Figure B.5.

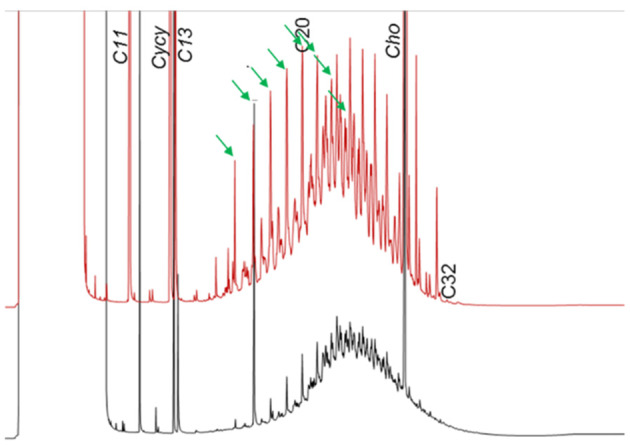
Extract from Figure B.4 focusing on the S‐C25 oil and the adipose tissue, showing that the n‐alkanes ranging up to about C22 (green arrows), then disappeared in other signals, particularly the little branched alkanes

Extract from Figure B.4 focusing on the S‐C25 oil and the adipose tissue, showing that the n‐alkanes ranging up to about C22 (green arrows), then disappeared in other signals, particularly the little branched alkanes