Figure C.3.

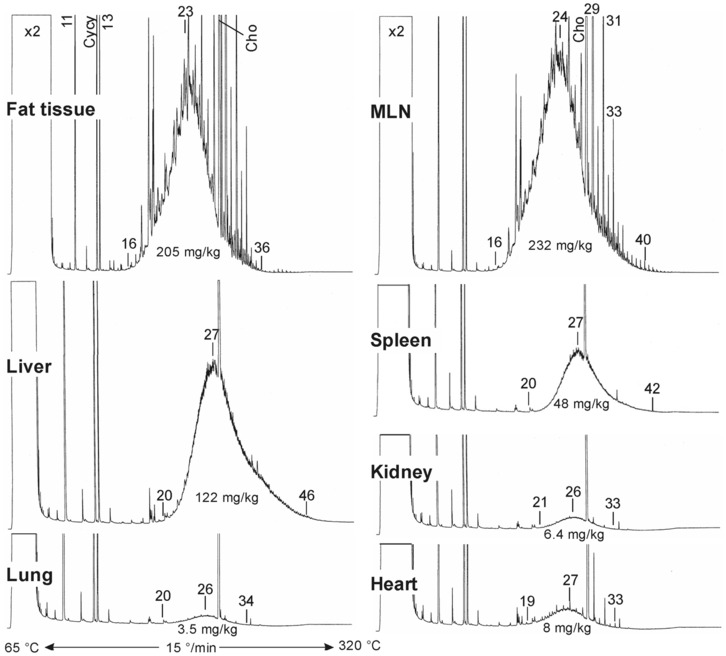
HPLC‐GC‐FID chromatograms from the various investigated tissues from the same subject. From Barp et al. (2014). © Elsevier Ltd

HPLC‐GC‐FID chromatograms from the various investigated tissues from the same subject. From Barp et al. (2014). © Elsevier Ltd