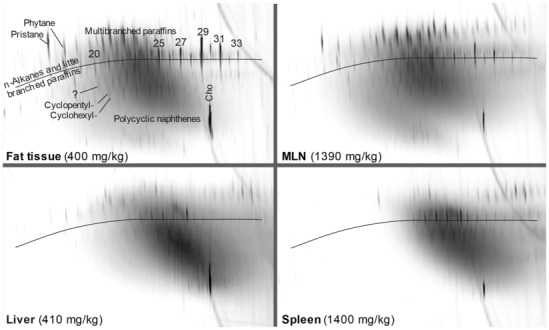
Figure C.5.

GC × GC‐FID plots of HPLC fractions of the saturated hydrocarbons from four tissues of the same male subject. Concentrations refer to total MOSH determined by HPLC‐GC. Horizonal axes: first dimension chromatography from polar column; vertical axes: second dimension chromatography on non‐polar stationary phase. From Biedermann et al. (2015). © 2014 Elsevier B.V.
