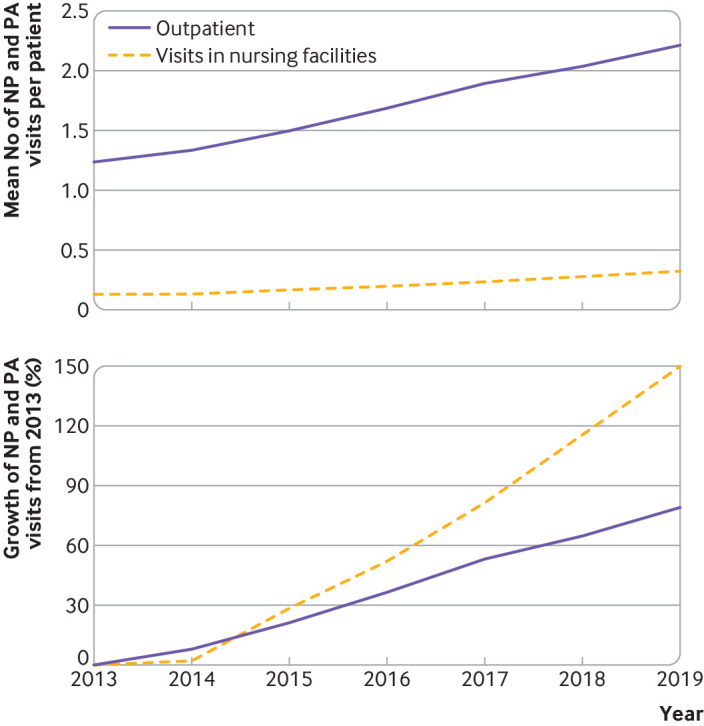
Fig 2.

Trends in the mean number of nurse practitioner (NP) and physician assistant (PA) visits by setting from 2013 to 2019 and relative growth in NP and PA visits from 2013 by setting. We focused on evaluation and management visits as defined using the Restructured Berenson-Egger Type of Service codes. We only included visits in outpatient and nursing facility settings. We applied an inverse probability weighting method to the number of visits per patient (appendix). 95% confidence intervals can be found in appendix table S7; estimates for the mean, standard deviation, median, and interquartile range are presented in appendix table S9
