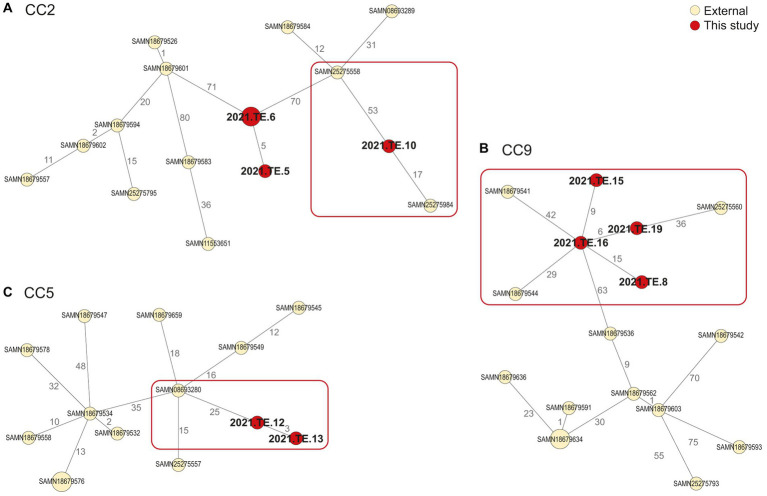
Figure 3.
Minimum spanning tree (MST) based on the cgMLST profiles of L. monocytogenes CC2 (A), CC9 (B), and CC5 (C). In red were reported the strains from this study, in light yellow were reported the public available genomic data (external) African strains from NCBI. The MST was visualized using GrapeTree (https://github.com/achtman-lab/GrapeTree) and graphically elaborated by Adobe Illustrator to highlight the genomic relatedness (red square).

