. 2023 Aug 11;14(35):9461–9475. doi: 10.1039/d3sc02054a

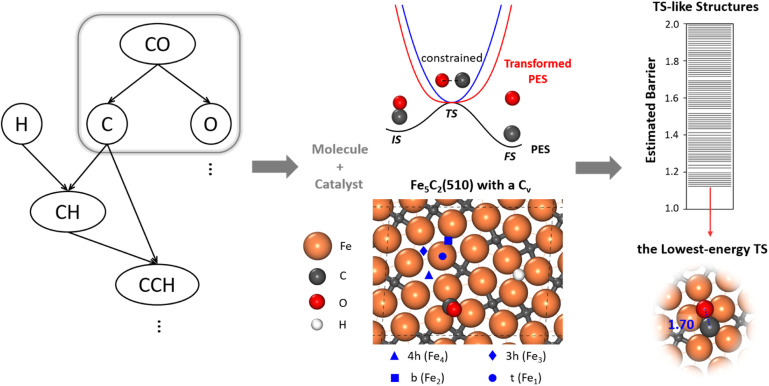
Fig. 1. Scheme of the machine-learning-based transition state exploration. A likely reaction map (Left) is first generated, which provides the reaction patterns of elementary reactions. For CO dissociation, the C–O distance of a reacting [C–O] molecule is constrained at the typical C–O distance of the CO dissociation TS via the bias potential energy of a simple harmonic oscillator (middle, blue line). The TS in the real PES (black line) is thus converted to the minimum of the transformed PES (red line). After the sampling, we use the CBD method to locate the TSs from the TS-like candidates (right). The top view of Fe5C2(510) with a C vacancy in a p(2 × 1) supercell is also shown to illustrate the catalyst, with the typical adsorption sites labelled, including 4-fold hollow (4h, Fe4), 3-fold hollow (3h, Fe3), bridge (b, Fe2) and top (t, Fe1) sites. The color scheme for atoms is as follows: Fe: orange, C: gray, O: red, and H: white.

Fig. 1