
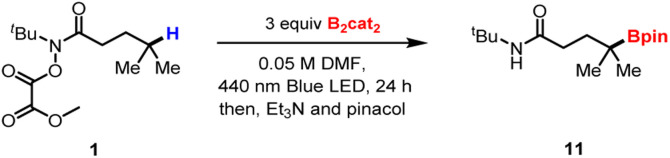
Optimization of reaction conditionsa.
| ||
|---|---|---|
| Entry | Deviation | Yieldb (%) |
| 1 | None | 98 |
| 2 | 0.4 M DMF | 26 |
| 3 | 0.25 M DMF | 65 |
| 4 | 0.1 M DMF | 96 |
| 5 | 0.1 M DMA | 45 |
| 6 | No light | Trace |
| 7 | Cook's conditionsc | 6 |
| 8 | White light | 42 |
| 9 | Green light | 23 |
| 10 | 3 equiv. B2Pin2 | Trace |
| 11 | 3 equiv. B2(OH)4 | Trace |
| 12 | 3 equiv. B2(OH)4 + 3 equiv. catechol | 63 |
| 13 | 1.5 equiv. B2Cat2 | 60 |

| ||
a
Performed on 0.1 mmol scale (0.1 mmol 1) in 0.05 M solvent.
b
Yields were determined using 1H NMR analysis with 1,3,5-trimethoxybenzene (Ar–H) as internal standard.
c
Performed with 0.1 mmol 1, 15 mol% Ni(hfacac)2·xH2O, 0.8 equiv. pyridine, 1.5 equiv. Zn and 1.2 equiv. MgCl2, in 0.2 M DMA/THF (3/1), 16 h.13