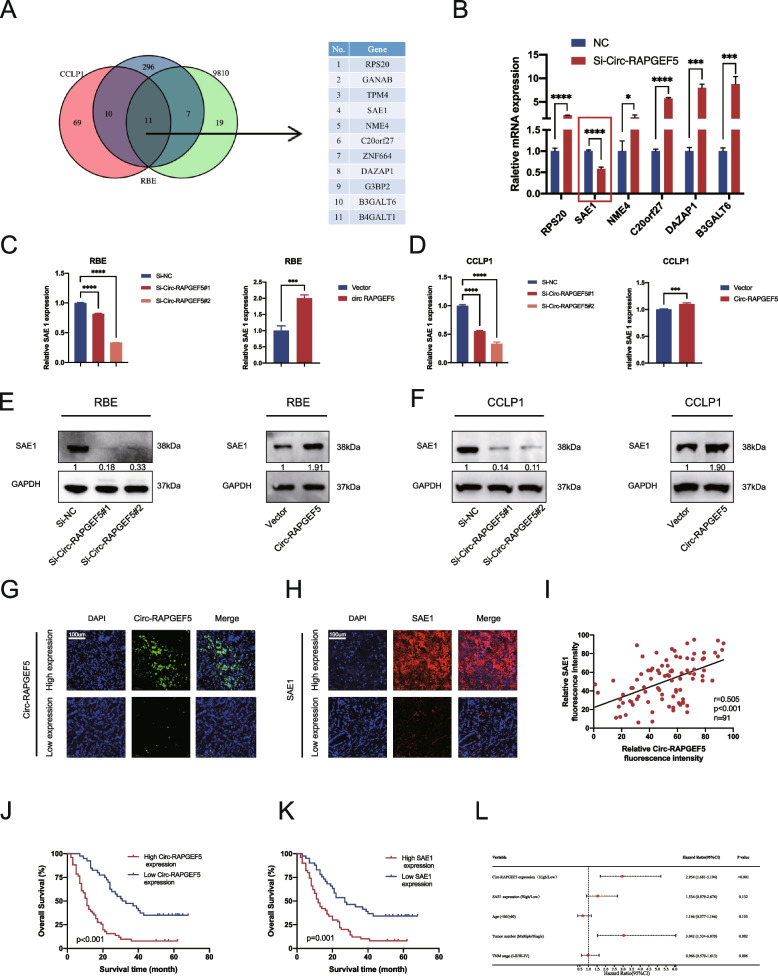
Fig. 4.
SAE1 might be a novel target of Circ-RAPGEF5. A Venn diagram of Circ-RAPGEF5 knockdown sequencing data in RBE, CCLP1, and 9810. B qRT-PCR analysis identified SAE1 was the only mRNA down-regulation after knockdown of Circ-RAPGEF5 C-D qRT-PCR analysis testing SAE1 mRNA expression after knockdown and overexpression of Circ-RAPGEF5 in RBE and CCLP1. E–F Western blot analysis accessed SAE1 protein level after changing the expression of Circ-RAPGEF5. G-H Representative FISH image for high and low expression of Circ-RAPGEF5 and SAE1 of the tissue microarray including 91 ICC patients' tumor tissues (20X). I Positive correlation between Circ-RAPGEF5 and SAE1 in 91 ICC patients' tumor tissues (P < 0.001). J-K Kaplan–Meier survival curves of patients with low or high Circ-RAPGEF5 and SAE1 expression based on tissue microarray. Survival comparison analysis was performed using the log-rank test. L Forest plot of multivariate COX analyses showing prognostic indicators for overall survival. *p < 0.05, **p < 0.01, ***p < 0.001, ****p < 0.0001

