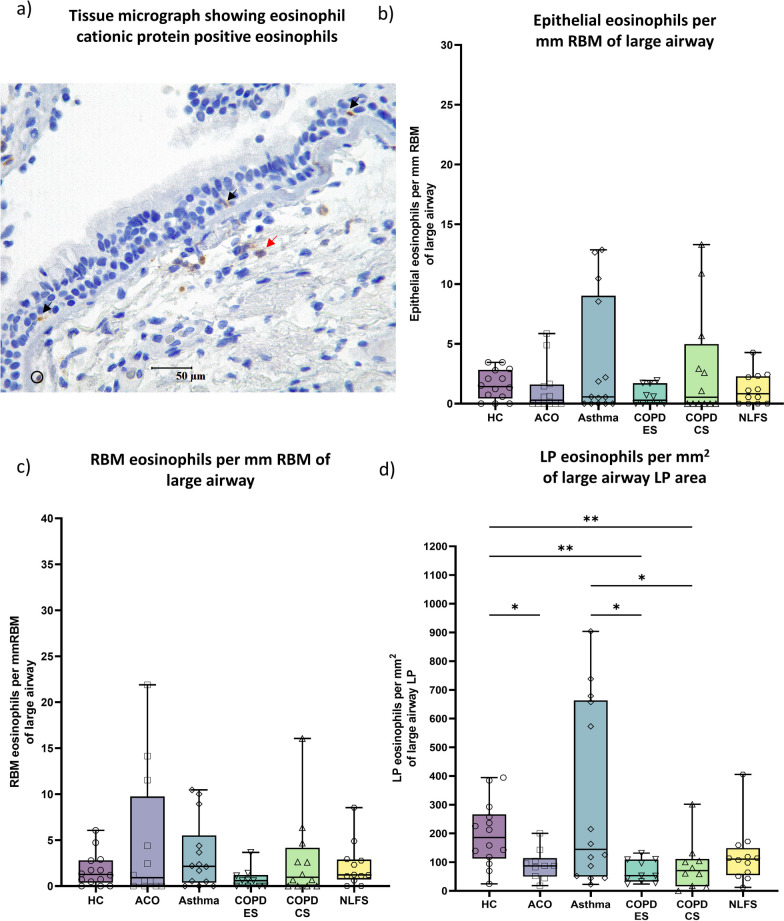
Fig. 4.
Representative tissue micrograph (a) for eosinophil cationic protein positive cells in the epithelium (black arrow) and lamina propria (LP) (red arrow). Box plots showing eosinophils in the large airway epithelium (b), reticular basement membrane (RBM) (c), and LP (d) of healthy control (HC), asthma COPD overlap (ACO), asthma, chronic obstructive pulmonary disease (COPD) ex–smokers (ES) and current smokers (CS), and normal lung function smokers (NLFS). The horizontal line inside each box represents the median; the top and bottom of each box represent the upper and lower quartiles, respectively; and the whiskers represent extreme values. ANOVA P-value representation * < 0.05, ** < 0.01, *** < 0.001, **** < 0.0001. Insignificant P values are not shown in the plot

