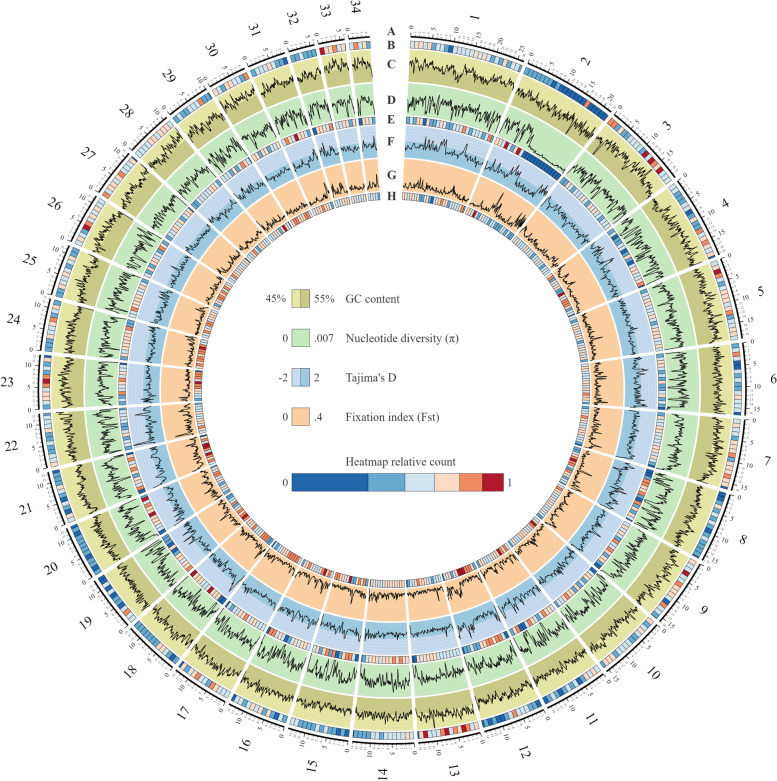
Fig. 1.
Circos plot of first 34 contigs of the giant kelp genome. Different aspects of the genome are represented in each concentric circle. A Scaffold size in MB. B Gene density heatmap. C Percentage of GC ranging from 45 to 55%. D Nucleotide diversity ranging from 0 to 0.007. E SNP density heatmap. F Tajima’s D values ranging from -2 to 2. G Fst values ranging from 0 to 0.4. H TE density heatmap. Line values are plotted on the same 200 kb sliding window with 40 Kb intervals while heatmaps are plotted over the same 1 MB windows. Heatmaps are in a 1.75 log scale for greater dynamic range at higher values

