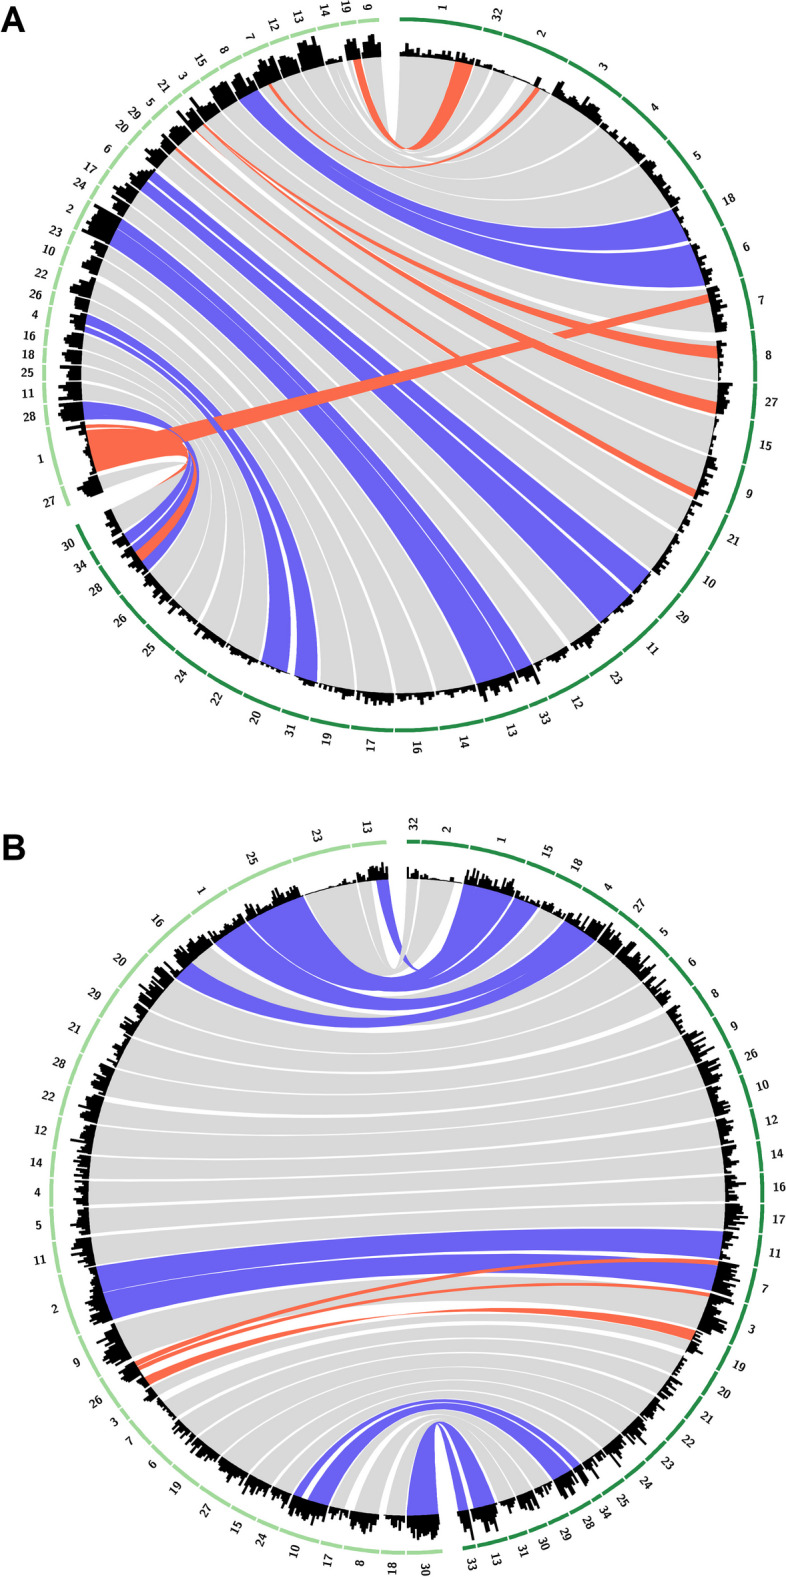
Fig. 4.

Synteny between the Macrocystis pyrifera genome (dark green) and the genomes of A Ectocarpus siliculosus and B Undaria pinnatifida (light green). Bands represent clusters of at least 10 single copy orthologs no more than 3 MB apart. Purple bands are potential chromosome splitting or fusion. Gray bands represent scaffolds that share the highest number of orthologs and, therefore, are most syntenic. Red bands represent orthologs in different scaffolds. When multiple bands overlap, bands with fewer number of orthologs superimpose bands with higher numbers of orthologs for easier visualization. Histogram represents density of single copy orthologs in 1 MB windows
