Fig. 5.
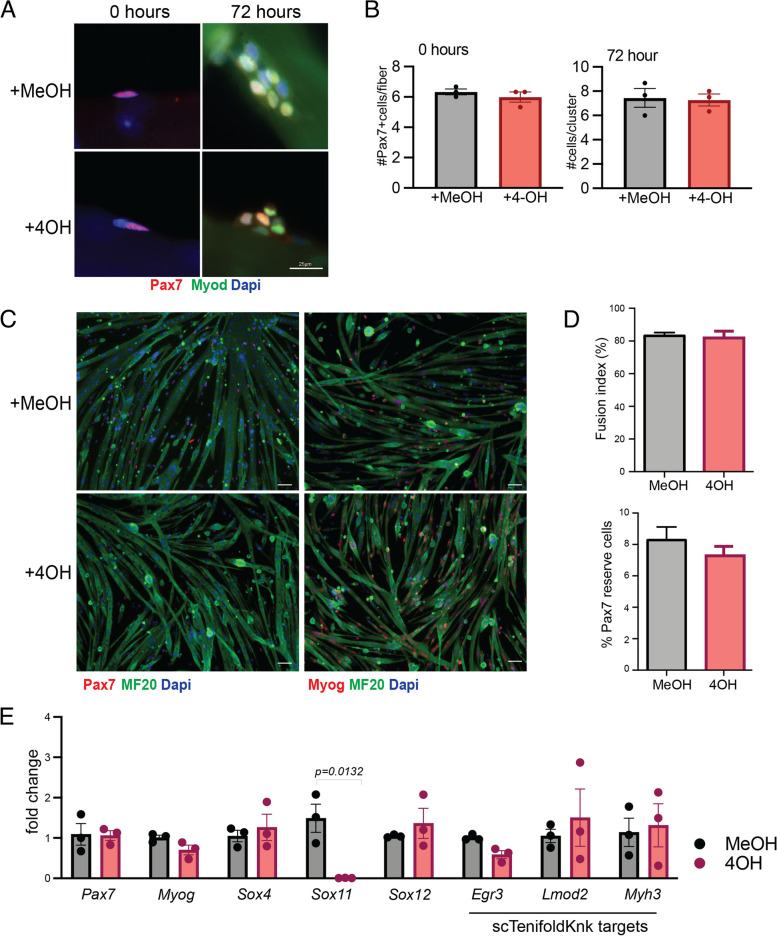
In vitro analysis of myogenic function Sox11-null myoblasts. A Representative immunofluorescence images to detect Pax7, Myod1, and nuclei (counterstained with dapi) of myofibers and their associated MuSCs isolated from Pax7CreER; Sox11fl/fl EDL muscle and fixed at 0 h (left panel) or cultured for 72 h with vehicle (MeOH) or 4-OH (right panel). B Quantification of the number of Pax7 + cells/myofiber at 0 h (left graph) and the number of cells/clusters at 72 h in culture (right graph), related to A. C Primary myoblasts isolated from Pax7CreER; Sox11fl/fl were cultured with MeOH (top panel) or 4-OH (bottom panel) plated at equal concentrations and induced to differentiate via serum starvation for 4 days to evaluate myogenic potential. Representative immunofluorescence images to detect Pax7, MF20, nuclei (DAPI) shown in the left panel, and Myog, MF20, and nuclei (DAPI) are shown in the right panel. D Quantification of the fusion indices of MeOH and 4OH-treated myoblasts, represented as the percent of nuclei fused into myotubes (top graph) and Pax7 “reserve” cells, counted as the total number of Pax7 + cells per field of view for each biological replicate (bottom graph). E Relative expression as measured by qRT-PCR for MuSC marker Pax7 and differentiation marker Myog, members of the SoxC subfamily (Sox4, Sox11, and Sox12), and genes predicted to be reduced by scTenifoldKnk (Egr3, Lmod2, Myh3). Scale bars: 25 µm in A, 50 µm in C

