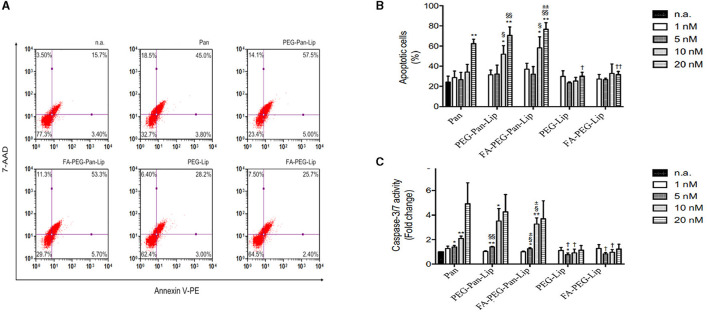
Figure 3.
Evaluation of apoptotic cell death. (A) CLBL-1 cells were treated with 20 nM folate-targeted and nontargeted liposomes loaded with panobinostat for 24 h and representative flow cytometry plots using Annexin V/7-AAD staining are shown. (B) The percentage of apoptotic cells was determined in CLBL-1 cells subjected to a range of concentrations of folate-targeted and nontargeted liposomes loaded with panobinostat. After 24 h treatment, apoptotic cells were determined by flow cytometry using the Guava Nexin Assay. (C) Caspase 3/7 activity was evaluated in CLBL-1 cells subjected to increasing concentrations of folate-targeted and nontargeted liposomes loaded with panobinostat. After 24 h treatment, activity was determined using the Caspase-Glo 3/7 assay. Results are expressed as means ± SEM fold change to control cells. *p < 0.05 and **p < 0.01 from n.a.; †p < 0.05 and ††p < 0.005 from Pan; §p < 0.05 and §§p < 0.01 from PEG-Lip; ±p < 0.05 and ±±p < 0.001 from FA-PEG-Lip. Statistical analysis was performed using Student's t-test. Values of p < 0.05 were considered significant. n.a., no addition.

