Figure 1.

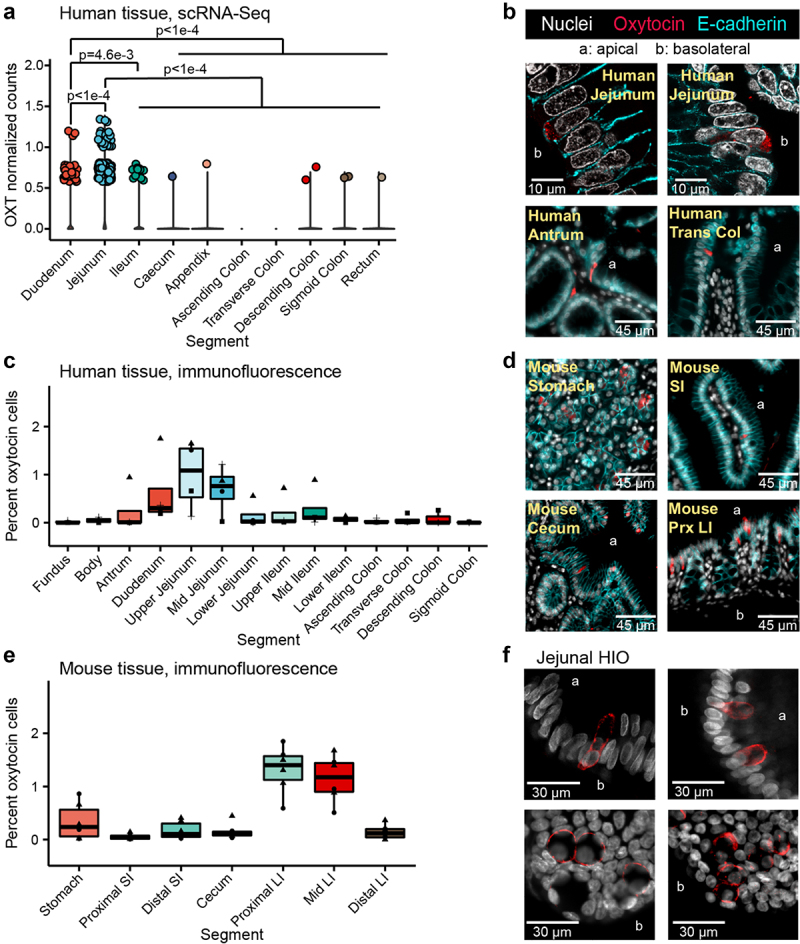
Oxytocin expression and production in the epithelium of the human and mouse gastrointestinal tract. a) log normalized counts of oxytocin expression in human intestinal epithelial cells reported by the scRNA-Seq data from the Gut Cell Atlas.32 Significance values reflect the number of rarefactions (of 10,000) in which the comparison had a p value >0.05 by a Dunn test with a Benjamini-Hochberg correction. These p values were similar whether the number of cells expressing oxytocin or oxytocin expression counts were used. Only significance values < 0.05 are shown. Oxytocin visualized by immunofluorescence imaging in b) 6 μm or 35 μm sectioned human jejunum, antrum, or transverse colon (trans col) and d) mouse stomach, small intestine (SI), cecum, or proximal large intestine (prx LI). Percentage of cells with oxytocin staining throughout the c) human or e) mouse intestinal tract. At least 3,000 nuclei were counted per segment. For c, shape denotes individual patient. For e, shape represents sex, male (triangle) or female (circle). f) oxytocin visualized by immunofluorescence imaging in whole 3D J2-NGN3 (top) or J1006 (bottom) human intestinal organoids (HIO), differentiated but not induced for NGN3. In all images, DAPI stained nuclei are shown in white, oxytocin staining in red, and E-cadherin staining in cyan (b and d only). Apical (a) and/or basolateral (b) sides are labeled. a: all regions rarefied to 1,712 cells; duodenum: 2 patients, jejunum: 4 patients, ileum: 4 patients, cecum: 6 patients, appendix: 4 patients, ascending colon: 4 patients, transverse colon: 6 patients, descending colon 3 patients, sigmoid colon: 7 patients, rectum: 3 patients; c: fundus, body, upper ileum, descending colon, and sigmoid colon: n = 3 unique patients, antrum, duodenum, upper jejunum, mid jejunum, lower jejunum, mid ileum, lower ileum, ascending colon, and transverse colon: n = 4 unique patients; e: n = 6 mice per region.
