
Figure 4.
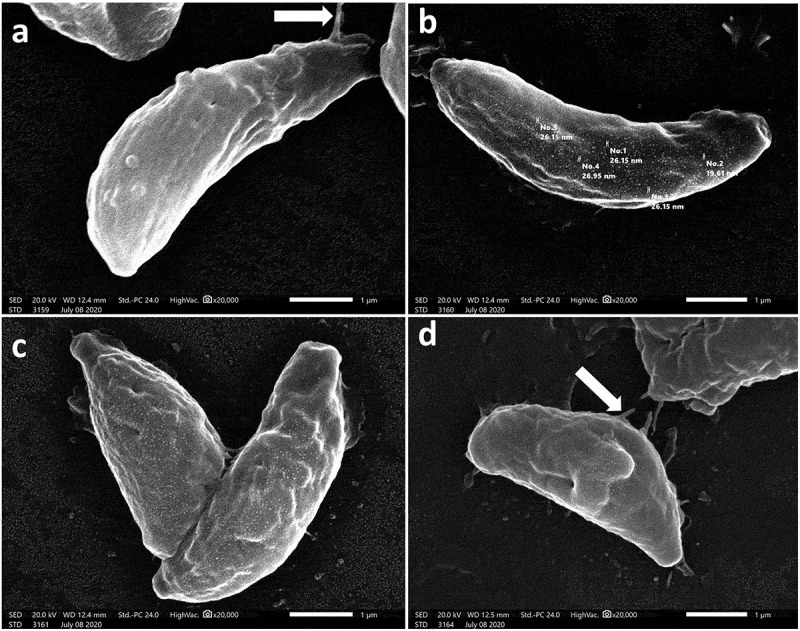
SEM images of SeNPs treated tachyzoites showing.
a. Rough surface with minute depressions and multiple protrusions which may form flagella-like projections (arrow) (x20000).
b. Rough surface covered with nanosized deposits (size range between 19.61 and 26.95 nm) (x20000).
c, d: Reduction in size of some tachyzoites with evident multiple surface depressions and flagella-like projections (arrow) (x20000).