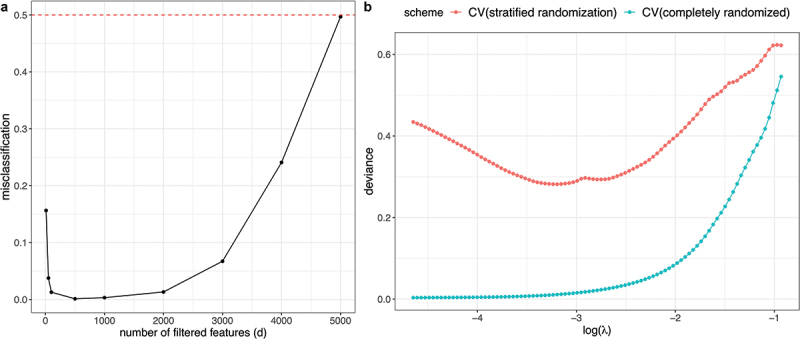
Figure 5.

A) CV evaluation using 1NN with feature filtering as described in example 3. The x-axis shows the number of remaining features after filtering (d) with representing no-filtering, and the y-axis shows the misclassification error using CV. The actual test error should be 0.5 (red dashed line), which is much higher than the CV error in the presence of strong filtering (small ). B) CV evaluation with different randomization schemes using the lipidomic breast cancer dataset in example 4. The x-axis shows the logarithm of lasso penalty (), and the y-axis is the deviance loss. The achieved deviance when using CV with the stratified randomization grouped by patient id (in red) is considerably higher than that from using CV with the completely randomized scheme (in turquoise).
