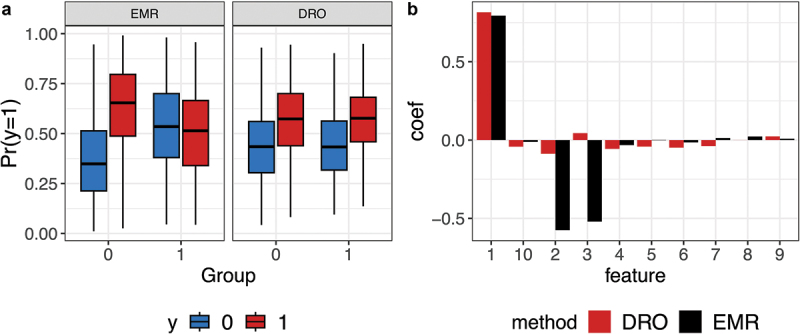
Figure 6.

Illustrative example comparing ERM and DRO. Data are generated using example 5 with a signal-to-noise ratio of 1 for the prediction task. There are two groups, with 90% samples from group 1 and 10% from group 2. In the underlying model, the first feature separates the two classes invariantly, but the second and third features have opposite effects on samples from the two groups. A) Boxplots of predicted probability for using the ERM and the DRO models separately for the two groups. B) Estimated model coefficients (y-axis) for both the DRO and ERM models.
