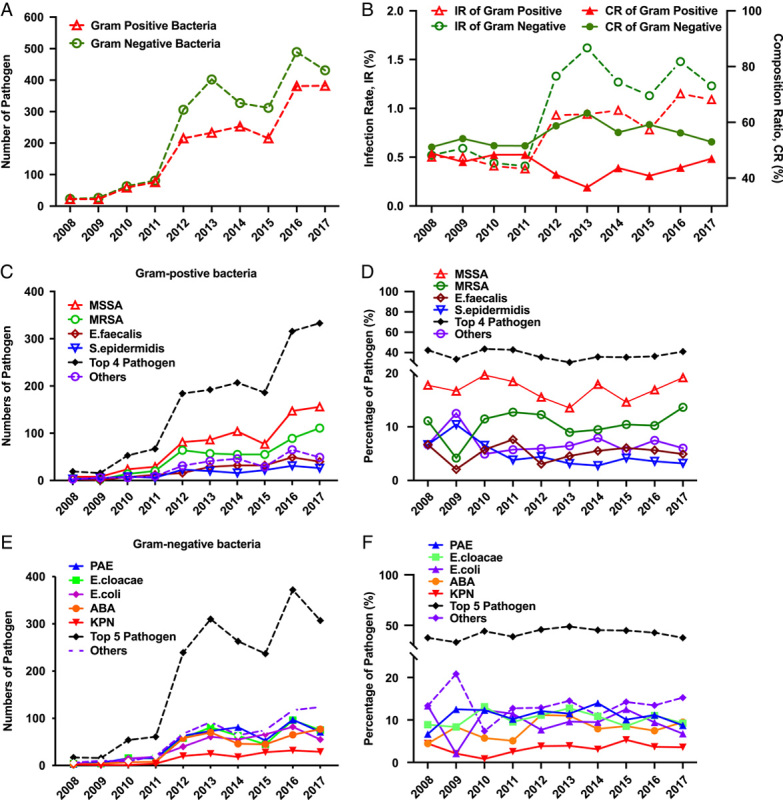
Figure 2.

The total number of cases and infection rates of pathogens and the top dominant strains have been tracked over the past decade. The total number of pathogen (Gram postive and negative bacteria) (A), and infection rate (IR, in dotted lines) or composition ration (CR, in solid lines) (B) of over the past ten years. The dynamic changes of top four Gram-positive strains (MSSA, MRSA, E. faecalls, S. epidermidis) and others in number (C) and persentage (D). The dynamic changes of top five Gram-negative strains (PAE, E.cloacae, E. coil, ABA, KPN) and others in number (E) and persentage (F).
