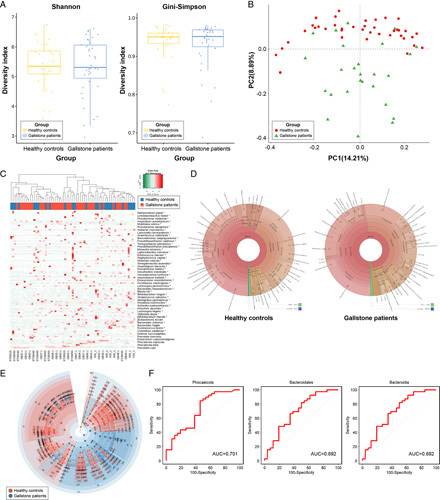
Figure 2.

Comparison of the fecal microbiome in patients with gallstones (GS) and healthy controls (HC). (A) Comparison of alpha diversity between the two groups (Shannon and Gini–Simpson indices). (B) Unweighted UniFrac principal coordinate analysis. GS (red dot) versus HC (green dot). (C) Heat map of taxonomic assignment of fecal samples. The colored columns in the upper part of the heat map indicate GS and HC, and those in the lower part of the heat map indicate each participant. Taxonomic abundance is proportional to color intensity (color scale in the upper-left panel of the figure). (D) Krona chart illustrating the differential abundance of bacteria in GS and HC. (E) Cladogram highlighting the distribution of the fecal microbiome with differential abundance. (F) Receiver operating characteristic curves of genera with dominant abundance in the fecal microbiome of GS compared with HC.
