Figure 6.

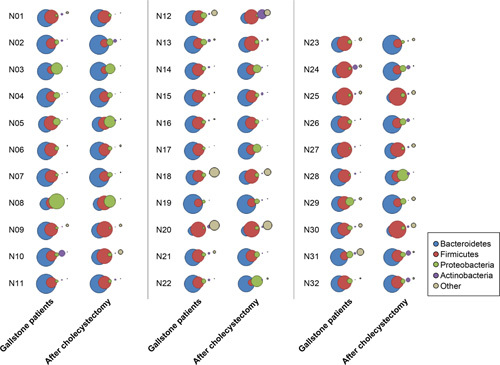
Bubble chart illustrating the differential abundance of bacteria at the phylum level between patients with gallstones and those 3 months after cholecystectomy.

Bubble chart illustrating the differential abundance of bacteria at the phylum level between patients with gallstones and those 3 months after cholecystectomy.