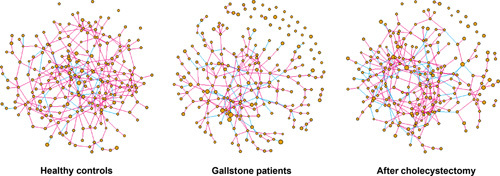
Figure 7.

Microbial network analysis. Each node indicates an amplicon sequence variant and node size indicates relative abundance. Each edge indicates the correlation between nodes. Pink and blue lines reflect positive and negative relationships between nodes, respectively.
