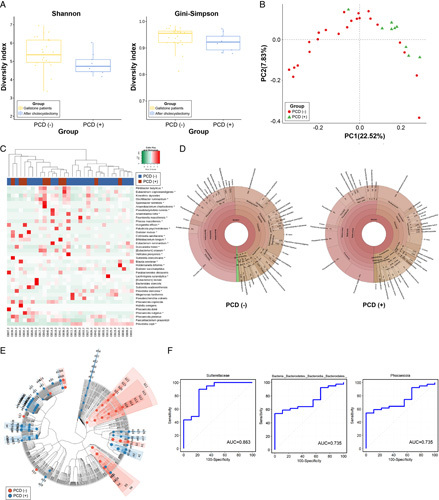
Figure 8.

Comparison of the gut microbiome in patients with gallstones with postcholecystectomy diarrhea (PCD) (−) and PCD (+). (A) Comparison of alpha diversity (Shannon and Gini–Simpson indices). (B) Unweighted UniFrac principal coordinate analysis. PCD (−) (red dot) versus PCD (+) (green dot). (C) Heat map of taxonomic assignment of fecal samples. The colored columns in the upper part of the heat map indicate patients with PCD (−) and PCD (+), and those in the lower part of the heat map indicate each participant. Taxonomic abundance is proportional to color intensity (color scale in the upper-left panel of the figure). (D) Krona chart illustrating the differential abundance of bacteria in PCD (−) and PCD (+). (E) Cladogram highlighting the distribution of the fecal microbiome with differential abundance. (F) The prediction of PCD 3 months after cholecystectomy with the relative abundance of fecal microbiome and receiver operating curve of top three genera with dominant abundance in the fecal samples. PCD, postcholecystectomy diarrhea.
