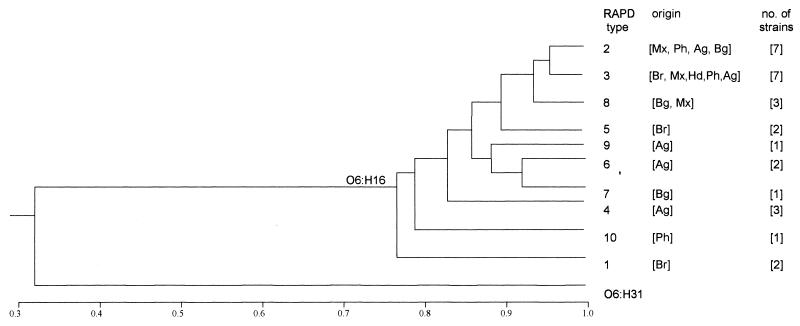
FIG. 2.
Phenogram representing the relatedness of O6:H16 ETEC strains. Amplification profiles generated by two primers were considered, and the comparison of samples was based on the proportion of bands in common (indicated on the scale). Groups of similarity were established by using the UPGMA method. RAPD types and their respective geographical origins and numbers of strains are indicated on the right (designations as shown in Table 1). An RAPD profile of a non-ETEC O6:H31 strain obtained with the same primers was included for comparative purposes.

