
FIGURE 1.
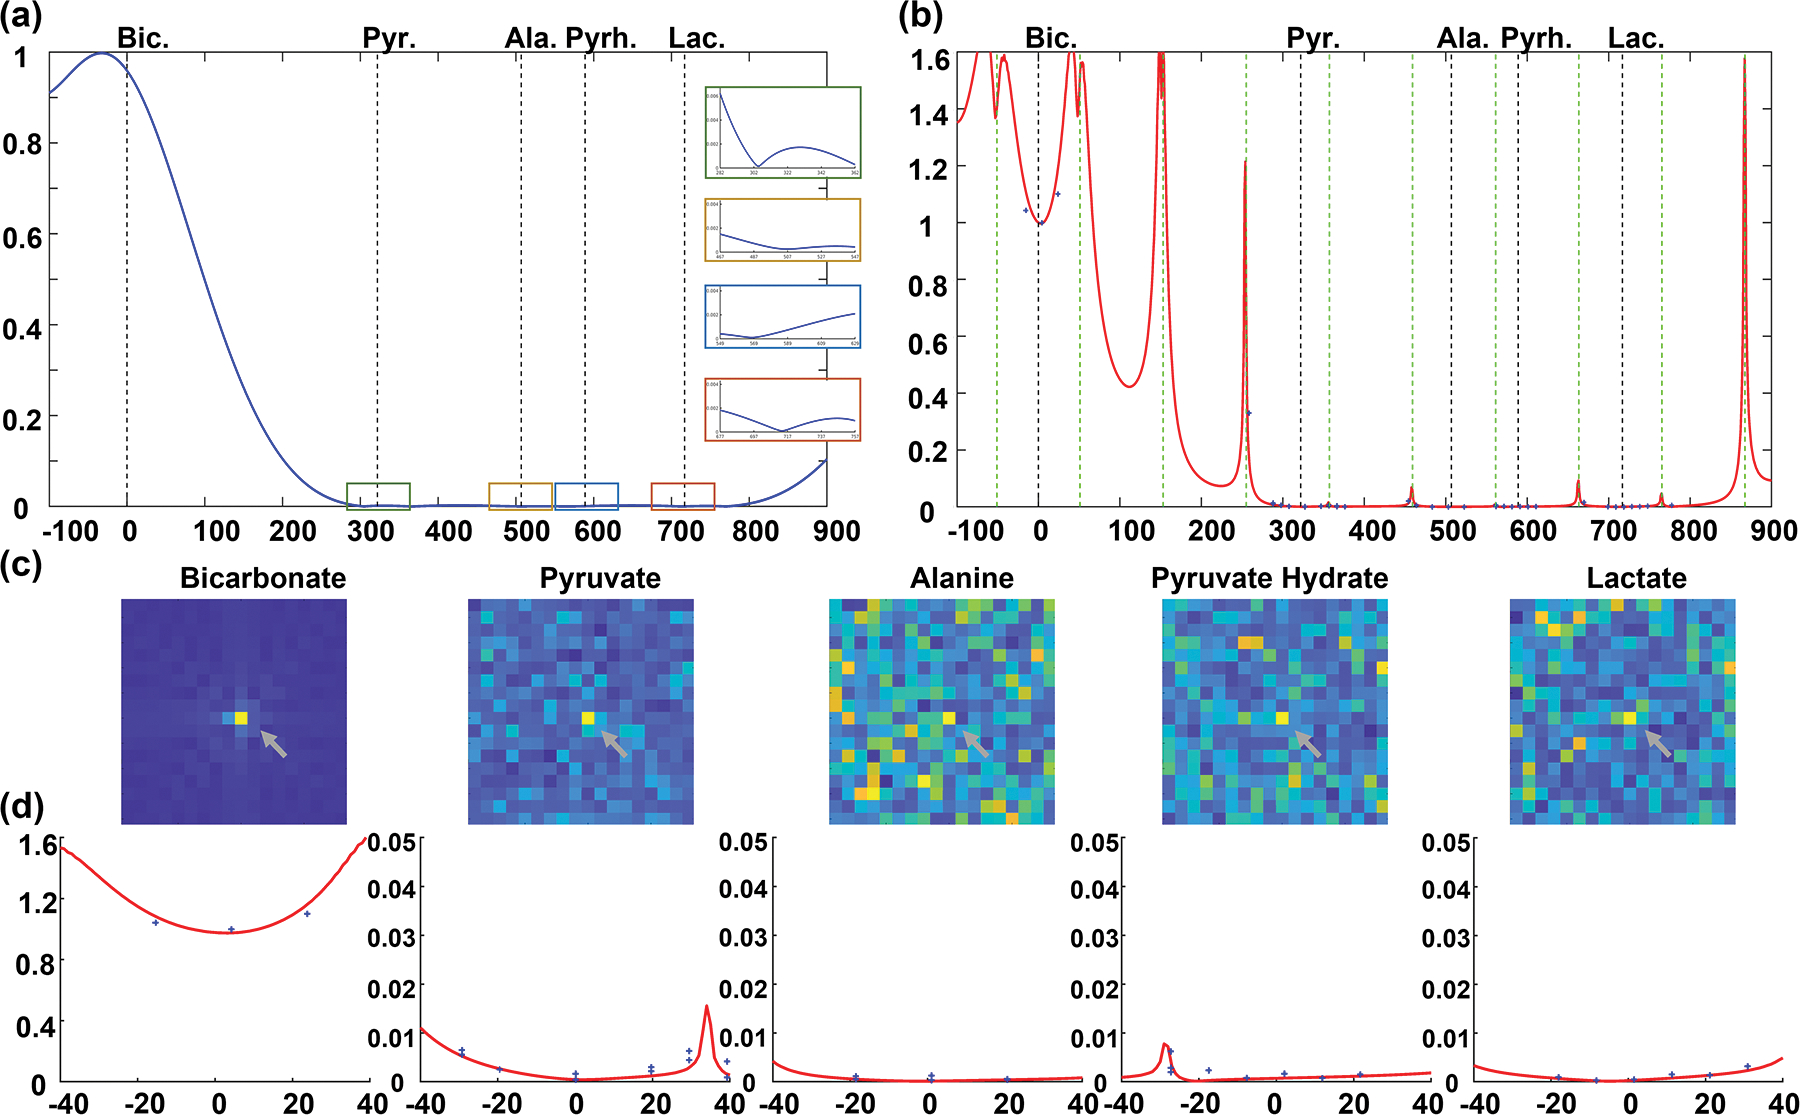
(a&b) The excitation profiles of MS-bSSFP bicarbonate sequence simulated by Bloch equation. (a) The excitation profile of bicarbonate-specific RF pulse alone with zoomed views (±40 Hz) at each metabolite frequency on the right side. (b) The excitation profile of the RF pulse in a MS-bSSFP sequence (magnetization from the mean of 64 RF pulses). The banding artifacts were shown by vertical green dot lines. (c) 13C urea phantom results (shown by grey arrays) acquired by bicarbonate MS-bSSFP sequence. (d) The excitation profiles in zoomed view (±40 Hz) at each metabolite frequency. The blue cross points indicate the normalized signals of urea phantom.