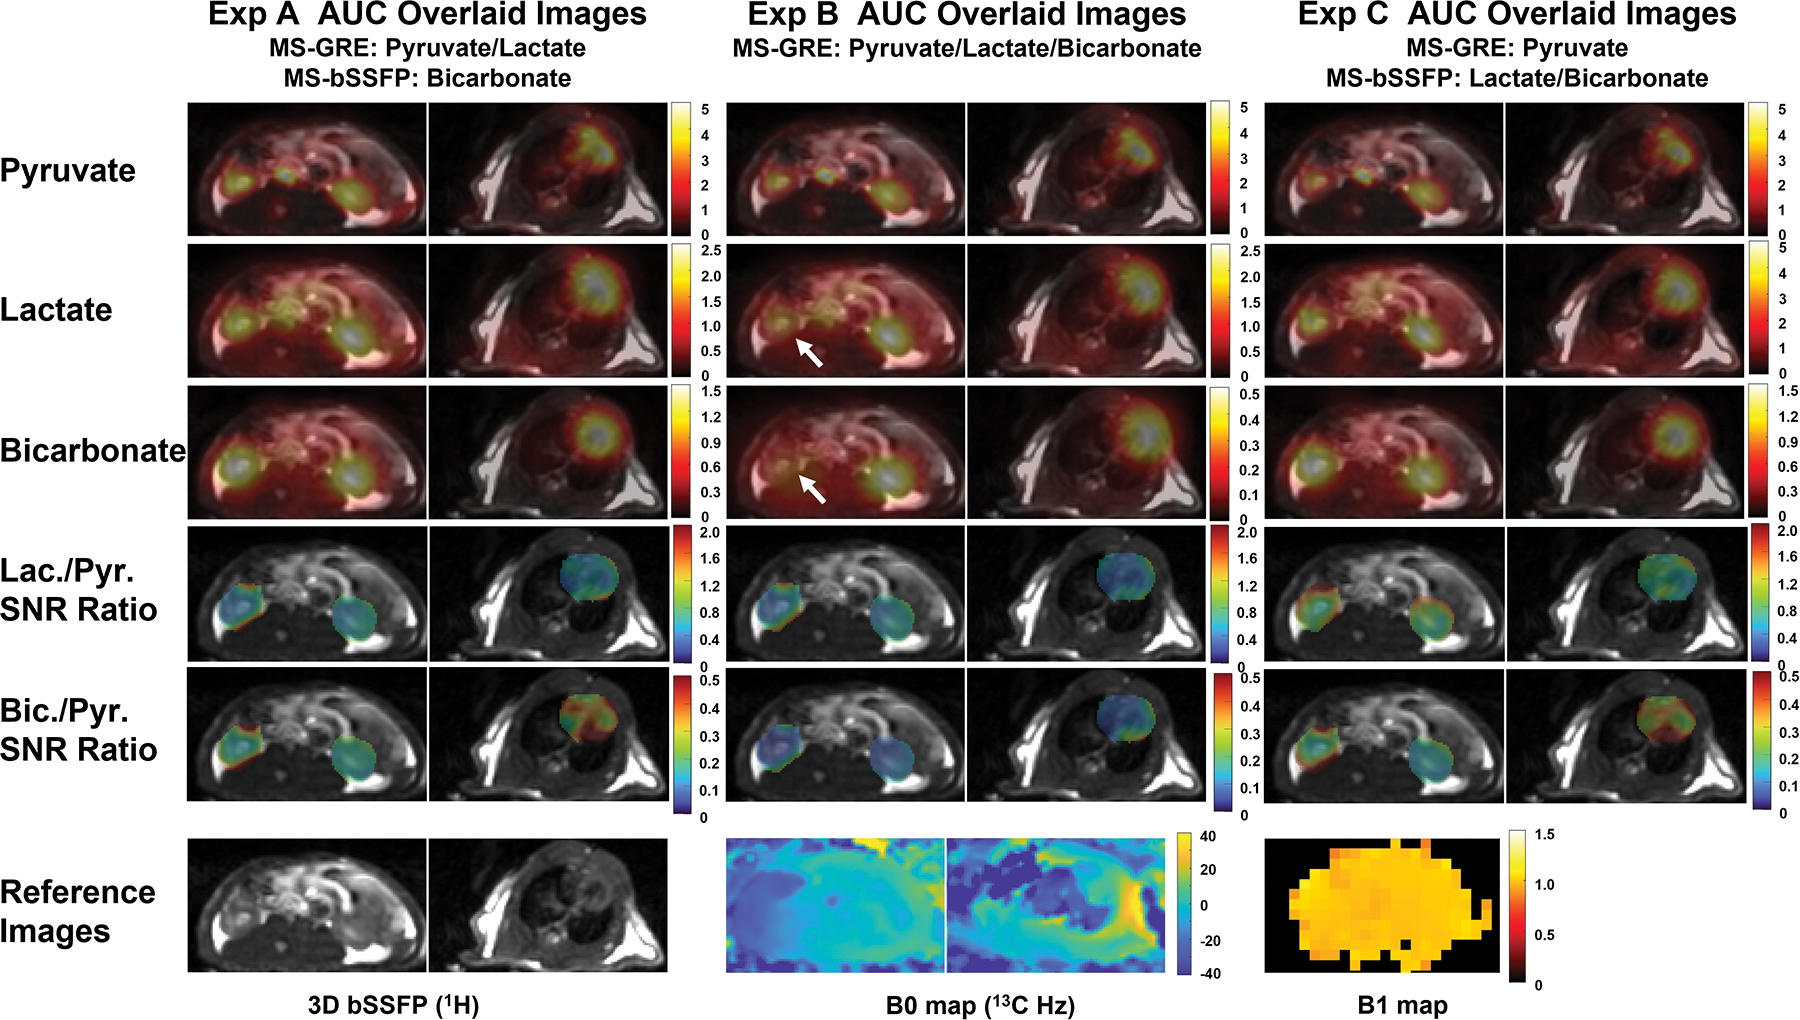
FIGURE 2.

Comparison between 3D MS-bSSFP sequence and 2D MS-GRE sequence in a healthy rat, using three different experiments: pyruvate and lactate 2D MS-GRE, bicarbonate 3D MS-bSSFP in Experiment A; pyruvate, lactate and bicarbonate 2D MS-GRE in Experiment B; pyruvate 2D MS-GRE, lactate and bicarbonate 3D MS-bSSFP in Experiment C. AUC images are scaled by maximum signal of each metabolite, while lactate-to-pyruvate and bicarbonate-to-pyruvate SNR ratio images are presented by a fixed scale range. The right kidney shows more blurring artifact with the lactate and bicarbonate 2D MS-GRE sequences compared to the 3D MS-bSSFP sequence (shown by grey arrows). This can be ascribed to the larger off-resonance frequency.
