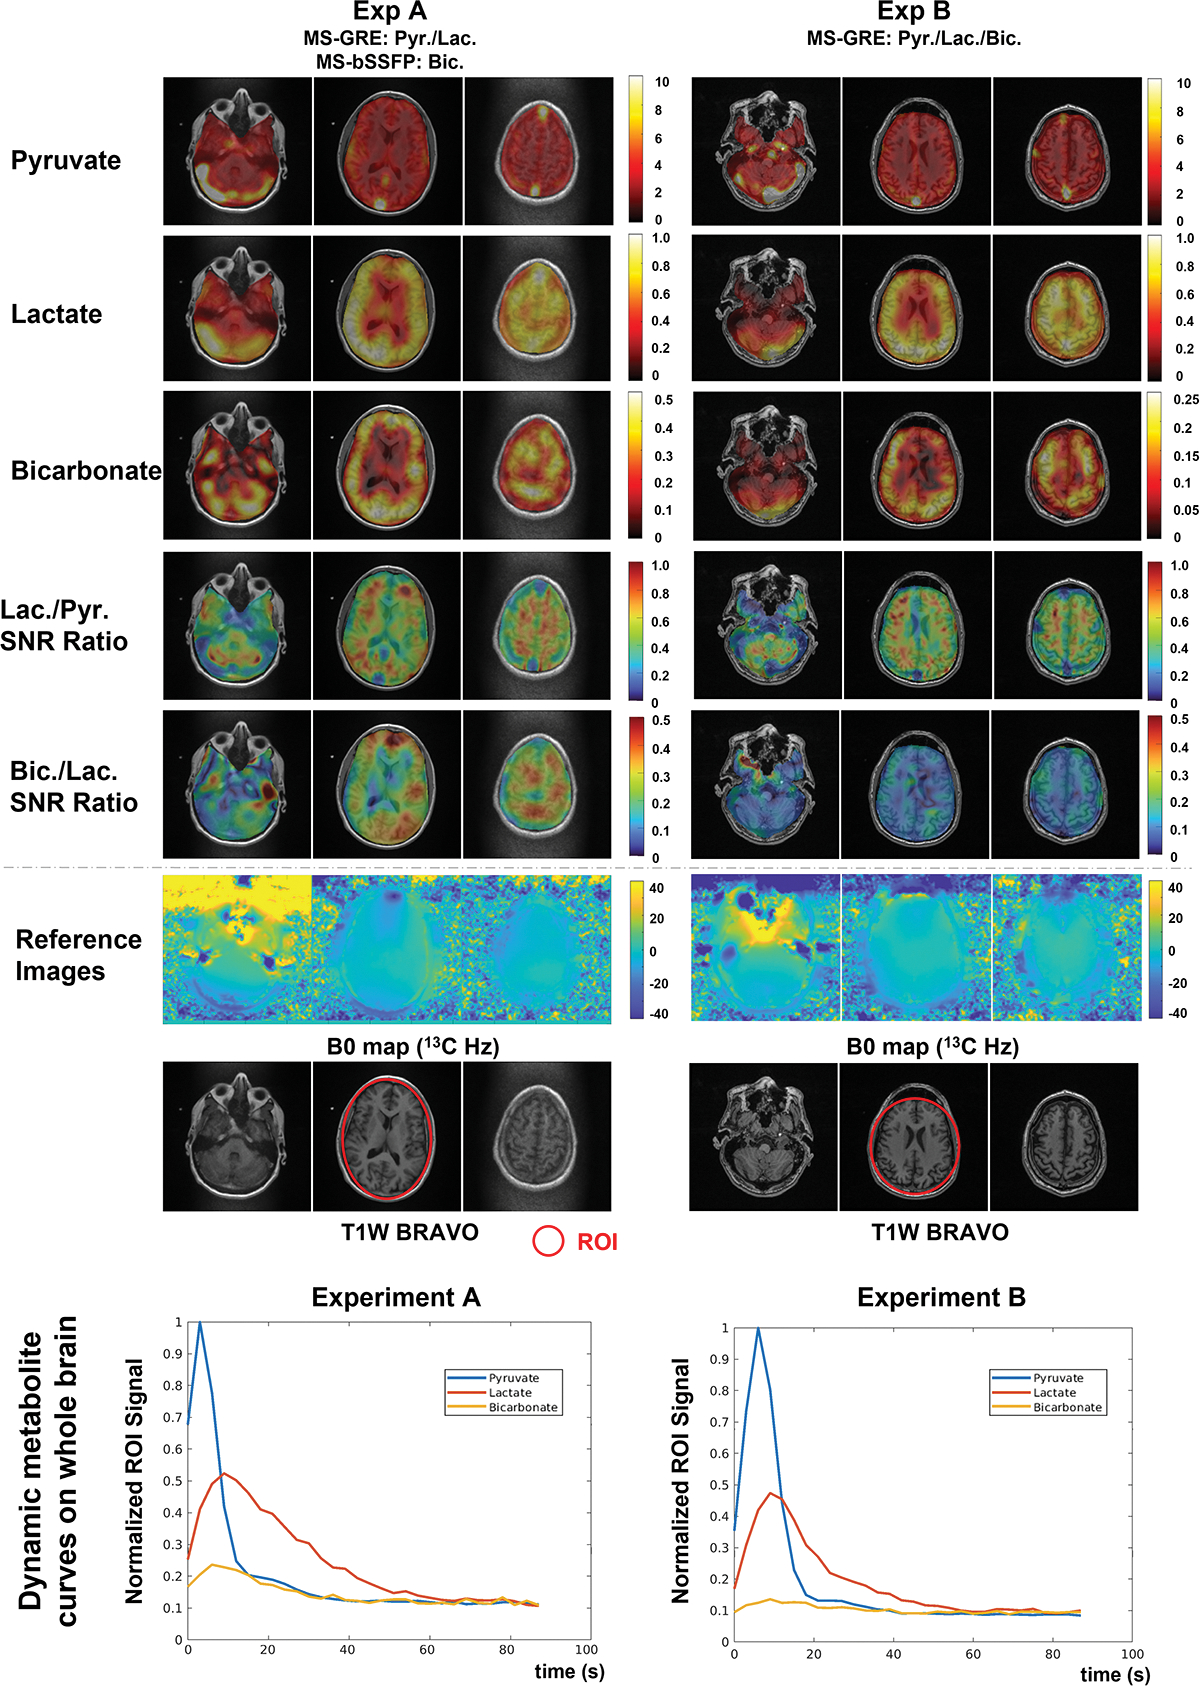
FIGURE 4.

AUC images of pyruvate, lactate, and bicarbonate, and bicarbonate-to-lactate SNR ratio maps and dynamic whole brain ROI curves of pyruvate, lactate, and bicarbonate on the brain of two volunteers. AUC images are scaled by the maximum signal of each metabolite, while bicarbonate-to-lactate and lactate-to-pyruvate SNR ratio images are presented by the fixed scale range, showing a higher bicarbonate SNR acquired by the 3D MS-bSSFP sequence than the 2D MS-GRE sequence. The SNR of the bicarbonate signal on both volunteers peaks at around 8 s after acquisition starts. The normalized bicarbonate SNR peak of 3D MS-bSSFP is approximately 2.1 times higher than the normalized SNR peak of 2D MS-GRE across the brain.
