
FIGURE 5.
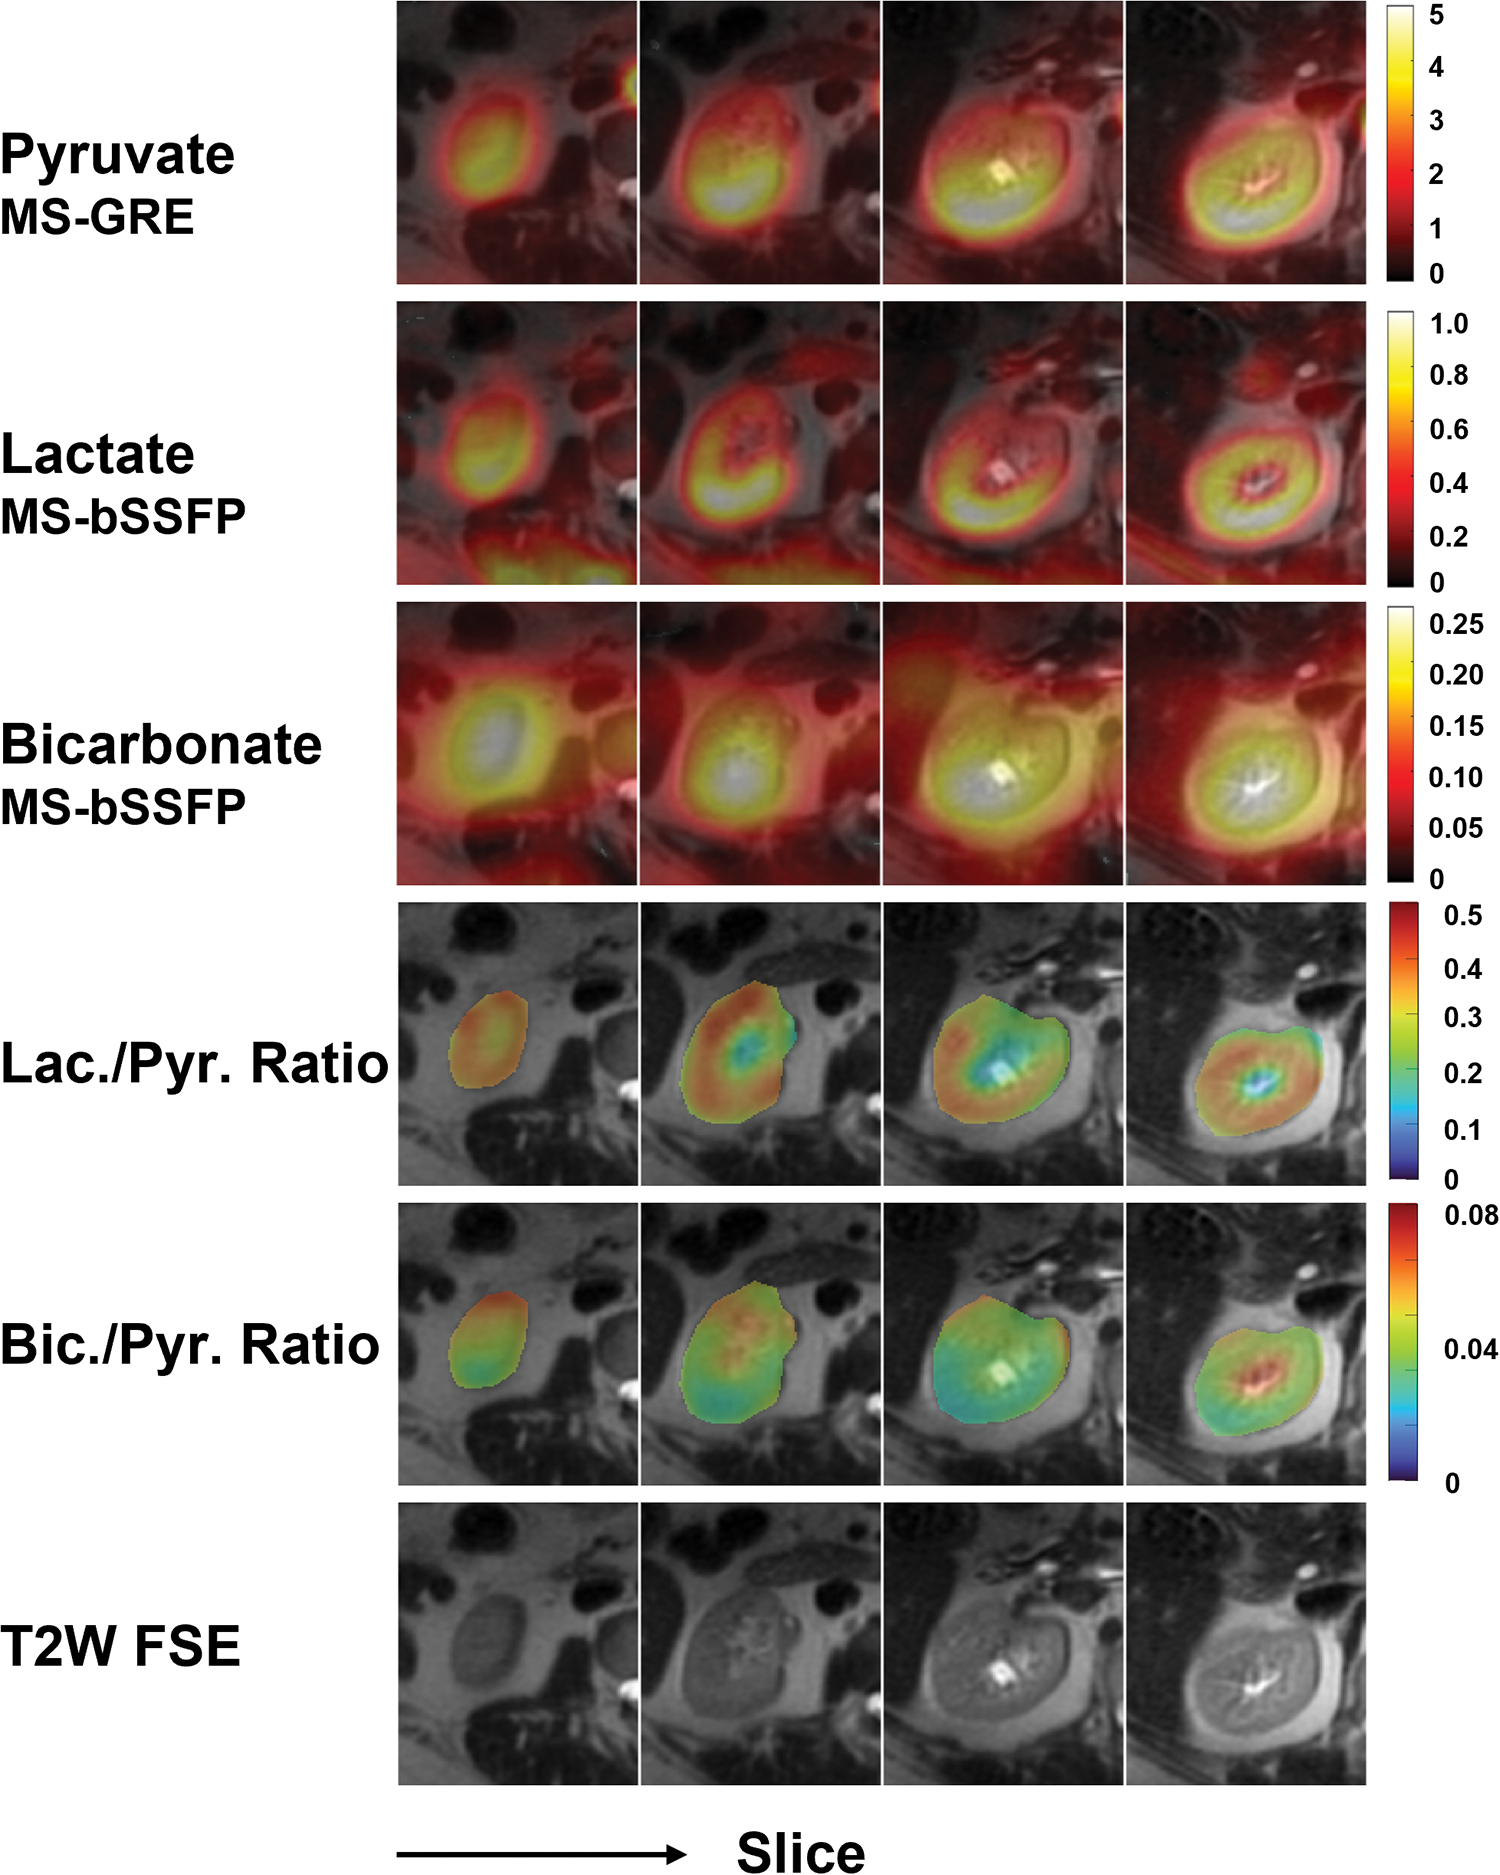
Hyperpolarized 13C AUC images of pyruvate, lactate, and bicarbonate of a human kidney. The lactate-to-pyruvate and bicarbonate-to-pyruvate SNR ratio maps are displayed using a fixed scale range.
Official websites use .gov
A
.gov website belongs to an official
government organization in the United States.
Secure .gov websites use HTTPS
A lock (
) or https:// means you've safely
connected to the .gov website. Share sensitive
information only on official, secure websites.
Hyperpolarized 13C AUC images of pyruvate, lactate, and bicarbonate of a human kidney. The lactate-to-pyruvate and bicarbonate-to-pyruvate SNR ratio maps are displayed using a fixed scale range.