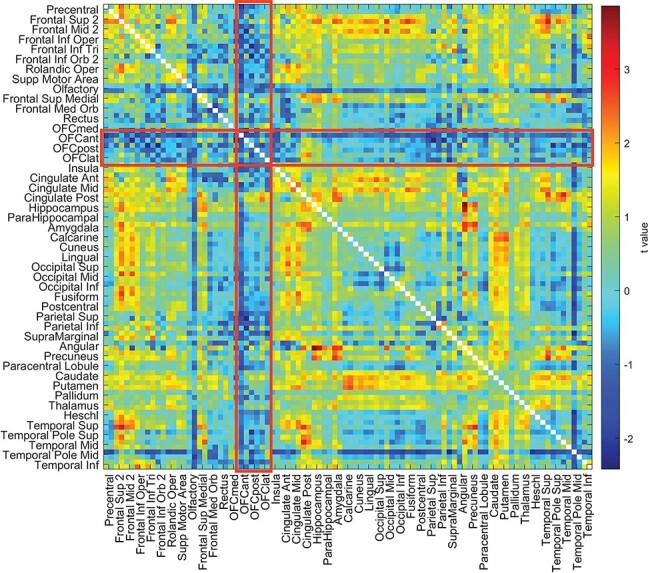
Fig. 4.

The resting-state functional connectivities involving the OFC are lower relative to other functional connectivities in the low BMI group than the mid BMI group in the HCP dataset. For the HCP dataset, the t values for the resting-state functional connectivity differences for the low BMI minus the mid BMI participants are shown, with age, gender, education, drinking frequency, smoking status and head motion regressed out. The areas referred to are anterior OFC (OFCant) to lateral OFC (OFClat) in the AAL2 atlas, and their connectivities with all other brain areas are within the red rectangles. The BMI groups and the numbers of participants in each are shown in Figure 5. The statistics are provided in the text and compared connectivities within the red rectangles for OFCant to OFClat with those outside the red rectangles.
