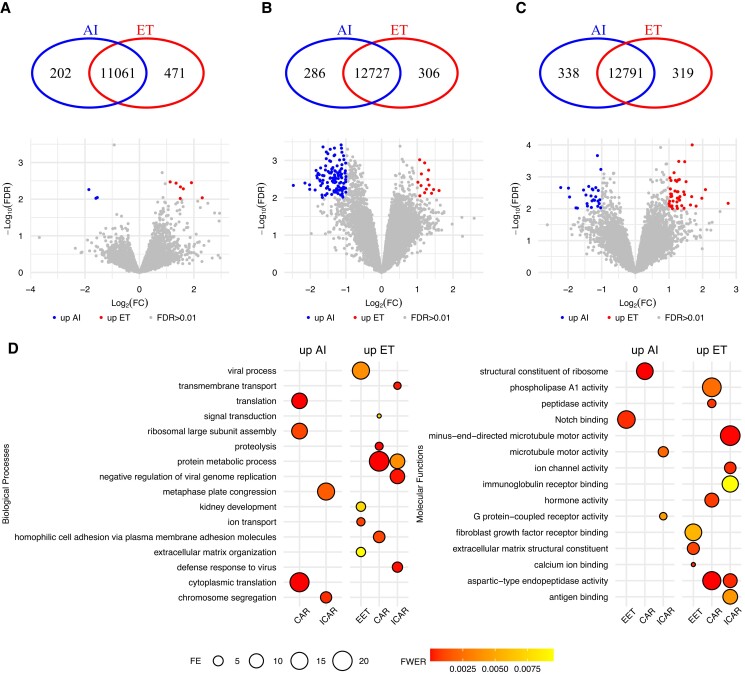
Fig. 4.
Differential transcript abundance related to in vitro– versus in vivo–produced embryos on gestation day 25. A) Chorion, B) CAR, and C) ICAR areas of the endometrium. D) Summary of the gene ontology enrichment of the DEGs. Within each panel, the Venn diagram indicates genes exclusively expressed in either group. The volcano plots show genes present in both groups tested, with genes showing quantitative differential transcript abundance shown in either red or blue. Only categories with FWER < 0.01 are plotted on D.

