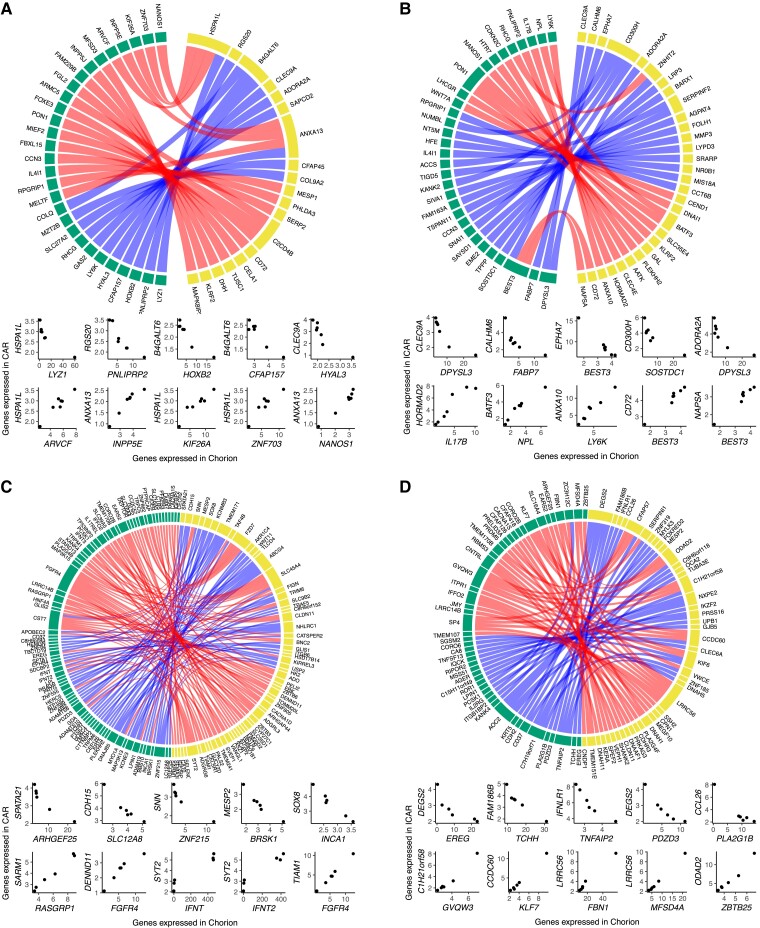
Fig. 6.
Coexpression networks present between conceptus and endometrium on gestation day 25. Chorion and A) CAR or B) ICAR from pregnancies initiated by artificial insemination. Chorion and C) CAR or D) ICAR from pregnancies initiated by the transfer of an in vitro–produced embryo. In each panel, genes expressed in chorion are represented in yellow and genes expressed in endometrium are represented in green. At the bottom of each network, there are scatterplots of representative gene pairs to illustrate their quantitative correlation. Only genes annotated with a symbol are depicted on these graphs.

