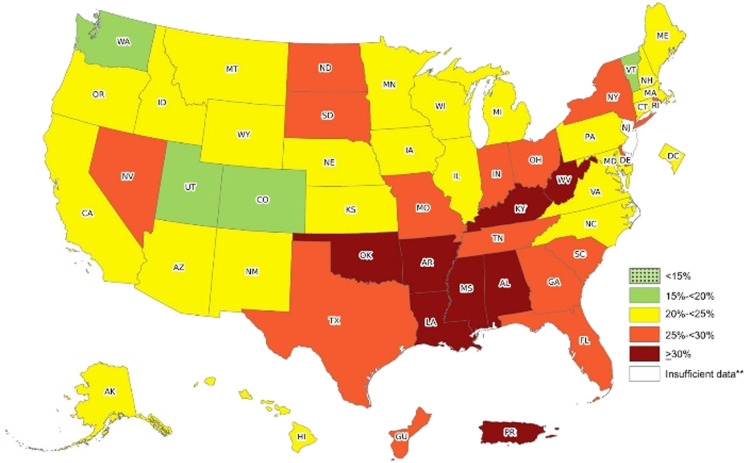
Figure 2.
Prevalence of self-reported physical inactivity* among US adults by state and territory, BRFSS, 2017-2020. Source: Behavioral Risk Factor Surveillance System. *Respondents were classified as physically inactive if they responded “no” to the following question: “During the past month, other than your regular job, did you participate in any physical activities or exercises such as running, calisthenics, golf, gardening, or walking for exercise?” ** Sample size <50, the relative standard error (dividing the standard error by the prevalence) ≥30%, or no data in at least 1 year. 4

