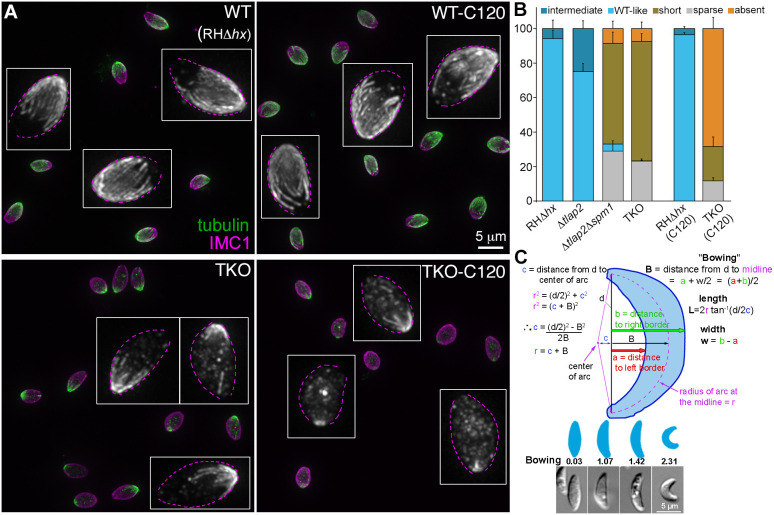
Fig. 2.
Comparison of cortical microtubule morphology and shape of extracellular wild-type parental, Δtlap2, Δtlap2Δspm1 and TKO parasites. (A) Projections of image stacks of wide-field deconvolved images of extracellular wild-type RHΔhx (WT) and TKO (Δtlap2Δspm1Δtlap3) parasites with (C120) and without cold-treatment. Green and grayscale, tubulin labeling by a mouse anti-acetylated tubulin antibody. Magenta, cortex labeling by a rabbit anti-IMC1 antibody. Insets: grayscale images of the tubulin labeling in a few parasites in each field displayed at 3× magnification. Dotted outlines were drawn based on IMC1 labeling. (B) Quantification of the proportions of extracellular RHΔhx, Δtlap2, Δtlap2Δspm1 and TKO parasites that display various characteristics in the cortical microtubule array. ‘Short’, ‘sparse’ and ‘absent’ phenotypes are as defined in Fig. 1. The ‘intermediate’ phenotype refers to arrays with detectable gaps but that have less severe phenotypes than the ‘sparse’ arrays. For RHΔhx and TKO parasites, measurements of parasites harvested after 2 h (C120) of cold treatment are also included. Error bars are s.e.m. from four independent experiments for Δtlap2, Δtlap2Δspm1 and TKO, and three independent experiments for RHΔhx. (C) Top, illustration for the calculation of length, width and bowing of extracellular parasites. Bottom, diagrams and sample images of parasites that have different bowing indices. Quantification of length, width, and bowing of extracellular RHΔhx, Δtlap2, Δtlap2Δspm1, and TKO (Δtlap2Δspm1Δtlap3) parasites are included in Table 1.

