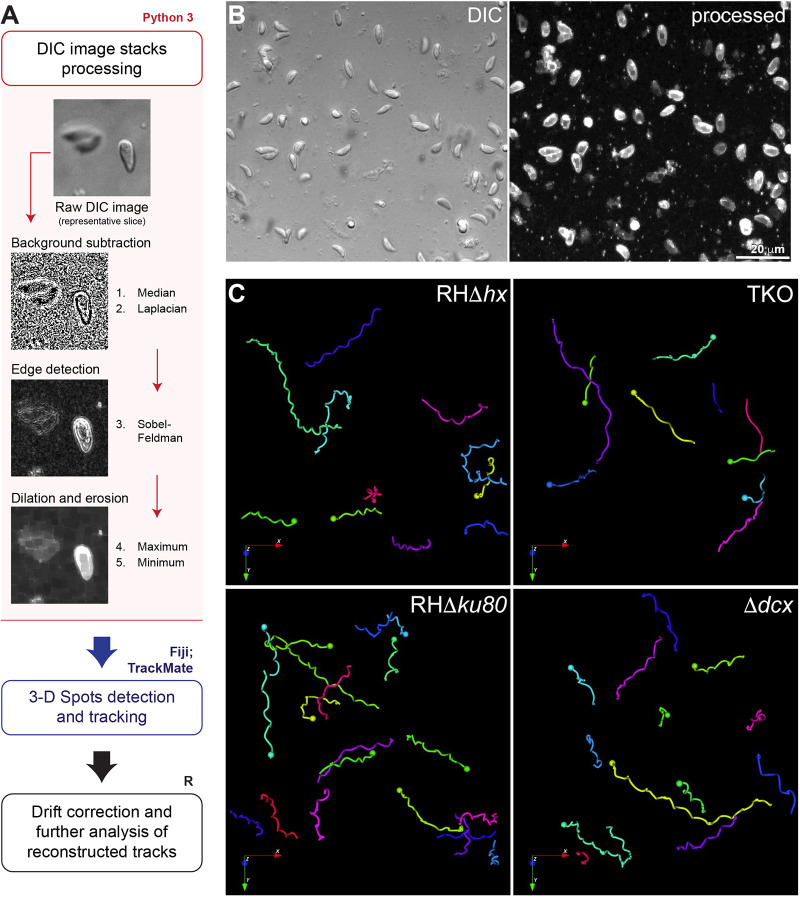
Fig. 3.
Workflow for image processing and automatic tracking of 3D motility data acquired by DIC imaging. (A) Schematic diagram of the image processing (pink outline and box), detection and tracking (blue outline) and tracks analysis (black outline) workflow for 3D motility data acquired by DIC imaging (pink). A representative area of a slice from a DIC image stack before processing and the resulting images corresponding to the filters applied on each processing step using Python3, showing the resulting high-contrast image. For details, see Materials and Methods. (B) Focused composite image of a DIC image stack (41 slices; 40 µm) of extracellular wild-type parasites in Matrigel and corresponding processed image (represented by its maximum projection) (see also Movie 1). (C) Examples of 3D tracks for motile RHΔhx parental, TKO, RHΔku80 parental and Δdcx parasites reconstructed in the Icy software (see also Movies 1–4). Length of arrows: 16 µm.

