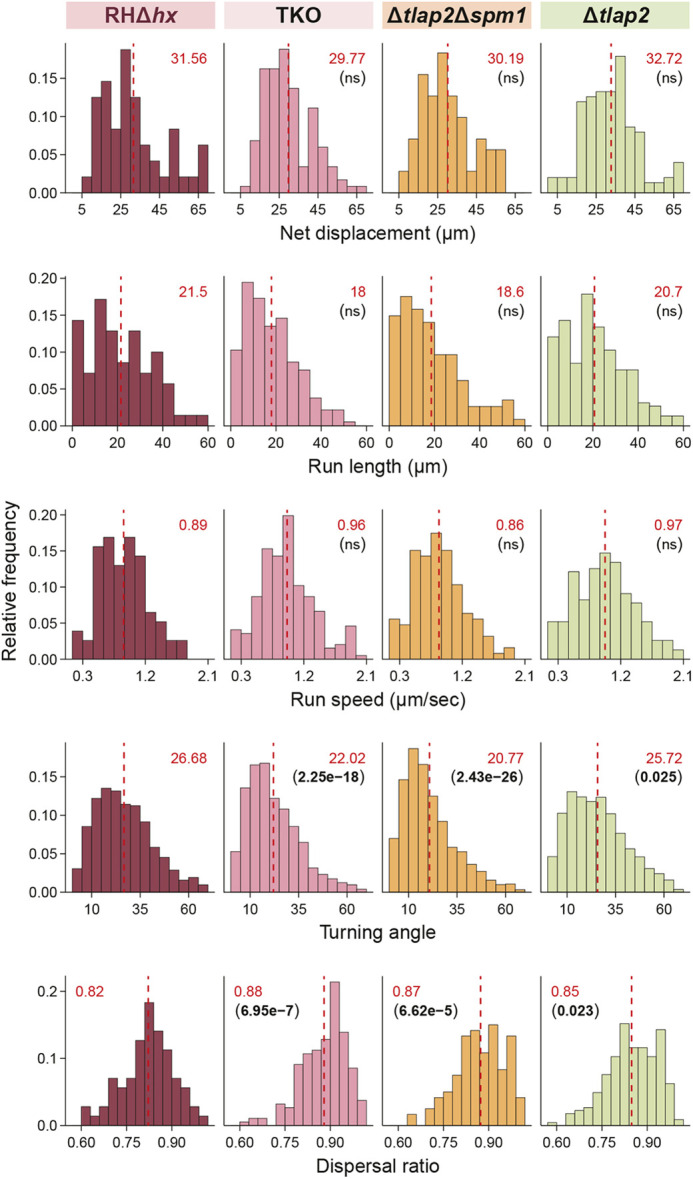
Fig. 5.

Comparison of 3D motility of wild-type parental, Δtlap2, Δtlap2Δspm1 and TKO parasites. Frequency distribution and statistical analysis of net displacement, run length, run speed, turning angle and dispersal ratio of parental RHΔhx, Δtlap2, Δtlap2Δspm1 and TKO (Δtlap2Δspm1Δtlap3) parasites. Mean values for individual histograms are shown at the top (in red) and also marked by the dashed line (see Table S1 for the number of data points for each analysis). P-values (in brackets under the mean values) were calculated by the Kruskal–Wallis test. ns, not significant.
