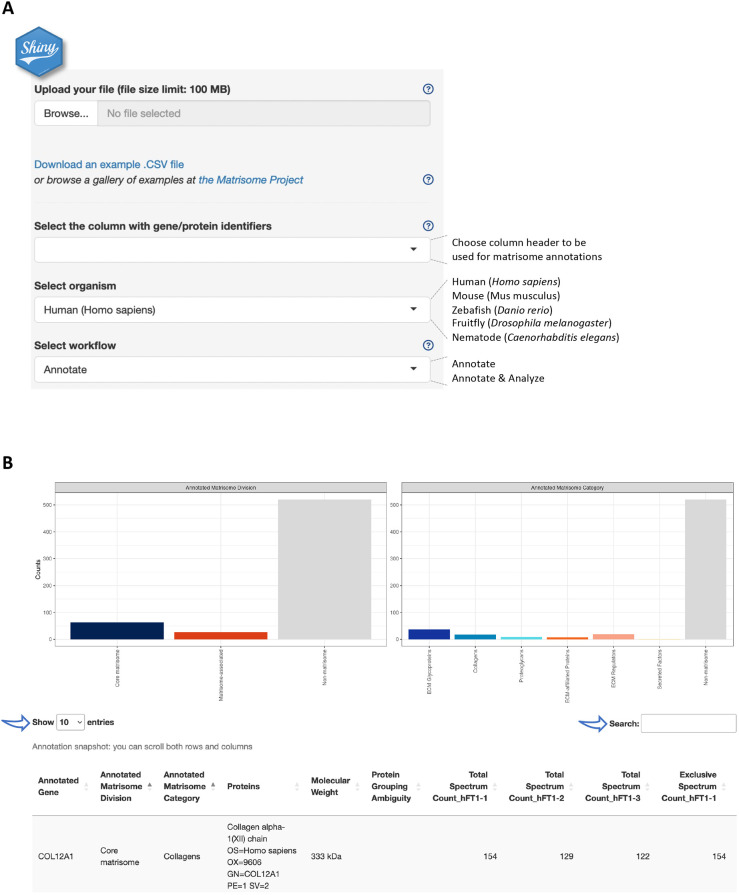
Fig. 1.
The web-based Matrisome AnalyzeR Shiny application interface. (A) Home page of the Matrisome AnalyzeR web application (https://sites.google.com/uic.edu/matrisome/tools/matrisome-analyzer) displaying input parameter options and output files. (B) Running the ‘annotate+analyze workflow’ using Table S1 as input, returns bar graphs (or ‘matribars’) representing the total numbers of matrisome molecules (here, proteins) classified according to matrisome divisions (left panel) and matrisome categories (right panel) across the entire dataset and a searchable and customizable table (arrows).

