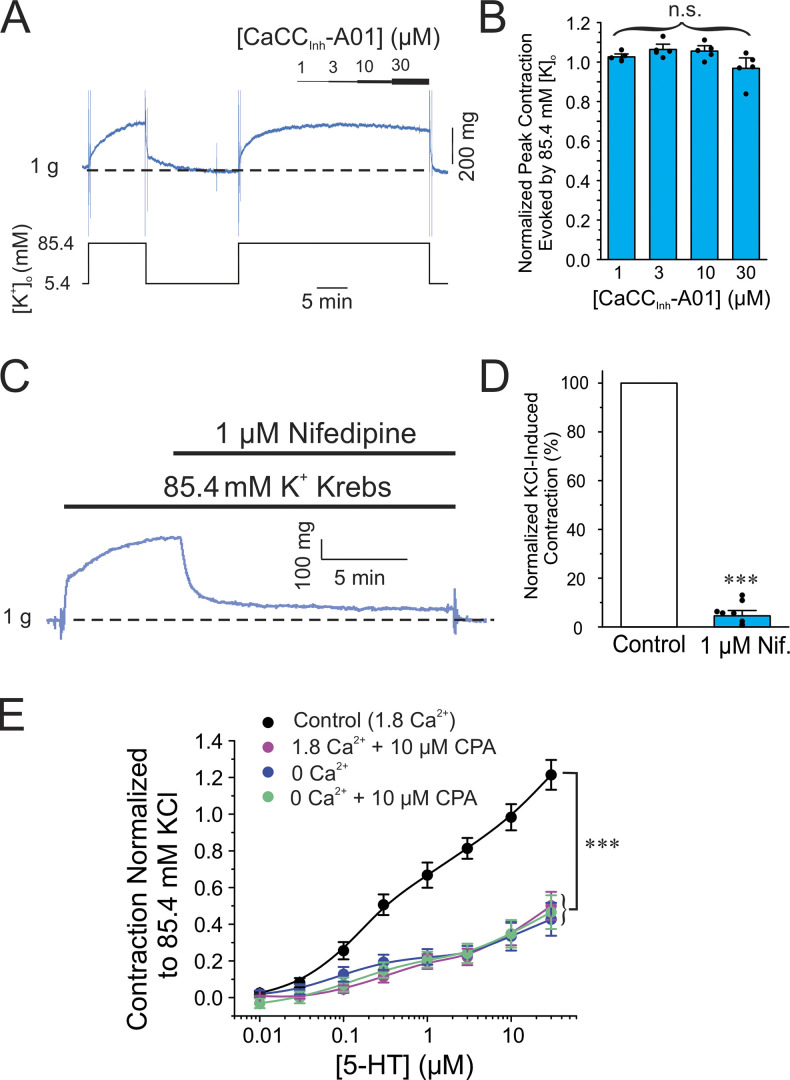
Figure 2.
The ANO1 blocker CaCCInh-A01 produced no effect on the high K+-mediated contraction of the mouse pulmonary artery. (A) Typical contractile force experiment showing that increasing the concentration of CaCCInh-A01 from 1 to 30 μM (progressively thickening black bar shown over the trace) produced no noticeable effect on the contraction (blue trace) elicited by 85.4 mM K+–Krebs solution (K+ concentration changes are indicated with the black line below the contraction trace). (B) Mean bar graph summarizing the effects of different concentrations of CaCCInh-A01 on the contraction elicited by high K+–Krebs solution as in A. Contractile force at each concentration of CaCCInh-A01 was normalized to the net contraction elicited by high K+–Krebs solution obtained during the prior wash with this solution as shown on the left side of A. Each bar represents the mean ± SEM and data points overlaid on each bar represents individual animals (N = 5). (C) Typical contraction experiment showing the potent block produced by the CaV1.2 blocker nifedipine (Nif.; 1 μM; top black bar) on the contraction (blue trace) elicited by 85.4 mM K+–Krebs solution (bottom black bar). (D) Mean bar graph summarizing the effects of nifedipine on the contraction mediated by high K+–Krebs solution as in A. The mean net contractile force measured in the presence of nifedipine was normalized to that measured in the absence of the drug just prior to its addition (blue bar). The bar with nifedipine is a mean ± SEM. Overlaid data points represent different animals (N = 10). (E) Mean cumulative dose–response curves to 5-HT in mouse pulmonary arteries from wild-type C57/BL6 mice in the presence of normal extracellular Ca2+ concentration with (magenta circles; 1.8 Ca2+ + 10 μM CPA; N = 4) or without (black circles, Control [1.8 Ca2+]; N = 14) 10 μM CPA to deplete SR Ca2+ stores, or in Ca2+-free with (green circles; 0 Ca2+ + 10 μM CPA; N = 6) or without (blue circles; 0 Ca2+; N = 18) CPA. Each data point is mean ± SEM of net contractile force normalized to the second high K+–Krebs solution-induced contraction (see examples in A and description in Materials and methods). The control (1.8 Ca2+) and 1.8 Ca2+ + CPA curves were reproduced from Fig. 1 B. For all panels, *** indicates a significant difference between means with P < 0.001; n.s.: not significant.

