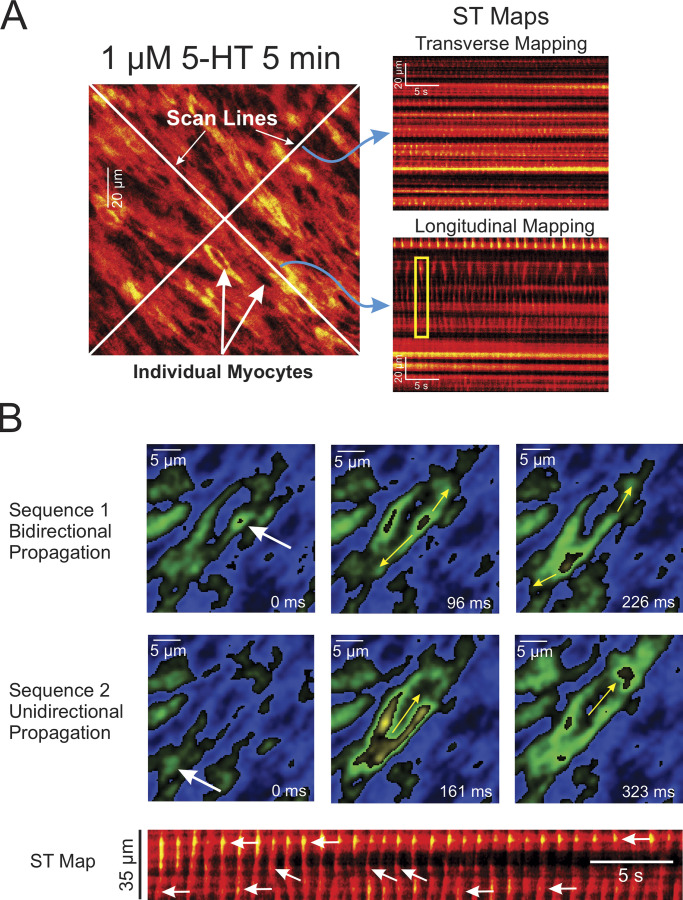
Figure 4.
Examples of asynchronous Ca2+ oscillations and waves in PASMCs from intact PAs from SMC-GCaMP3 mice. (A) Examples of ST maps created by analyzing a video recorded from an intact endothelium-denuded PA from a SMC-GCaMP3 mouse exposed to 1 μM 5-HT for 5 min. The left larger image was extracted from a video stack onto which were drawn two white scan lines. The scan lines were oriented along or orthogonally to the main axis of the cells. The two images on the right show ST maps that were created by reporting fluorescence intensity registered under the scan line drawn orthogonally (Transverse Mapping) or along (Longitudinal Mapping) the main axis of the cells, respectively. The top ST map clearly shows a lack of cell-to-cell propagation of Ca2+ transients (bright luminous spots) in the transverse direction. Longitudinal mapping also suggests a lack of or poor evidence for propagation from one cell to the next along the main axis of the cells. Ca2+ transients propagated along the main axis of the cells (as evidenced from the near vertical streaks of fluorescence) but collapsed at the end of the cells, failing to propagate the signal to neighboring cells (one example highlighted by the yellow box). (B) Two series of images showing the initiation and propagation of two Ca2+ waves (top and bottom sets of images) taken at different times from the original movie. The white arrows show trigger sites. The yellow arrows illustrate the direction of propagation of the waves. The ST map at the bottom of the panel was reconstructed from the entire video with time passing from left to right. The white arrows indicate the location of at least three trigger sites that initiated Ca2+ waves in this particular cell. The trigger sites randomly changed from either of the cell tips or the middle of the cell. Bidirectional propagation from the middle site is evident from the “V” shape appearance of these particular waves.

