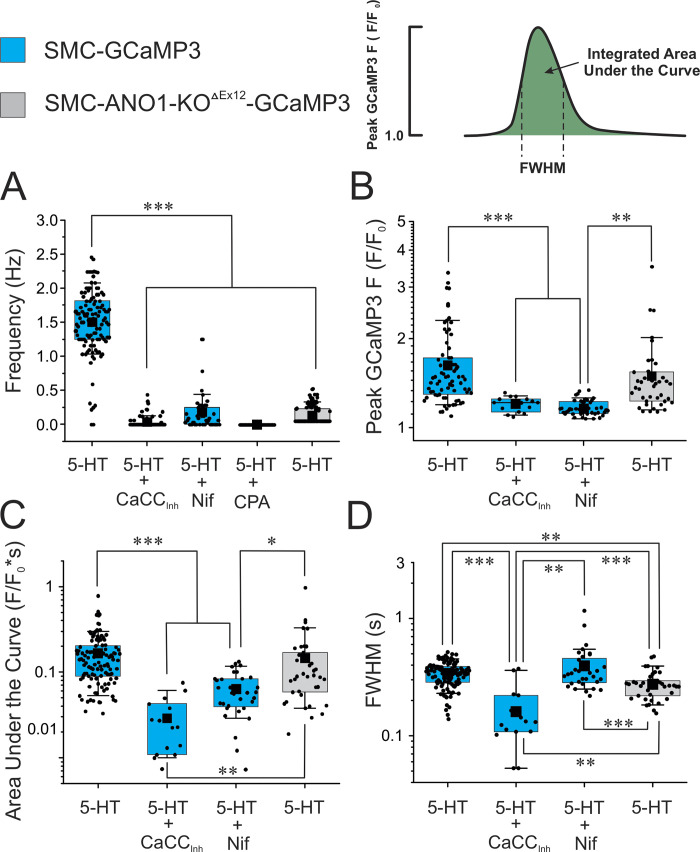
Figure 6.
Asynchronous Ca2+ oscillations evoked by 5-HT require both functional ANO1 and VGCC. Mean data for each of four parameters measured from Ca2+ transients elicited by 1 μM 5-HT (5 min) in PA from control SMC-GCaMP3 (light blue bars) or SMC-ANO1-KO-ΔEx12-GCaMP3 (light gray bars) mice. (A–D) The frequency of Ca2+ oscillations (A), peak Ca2+ transient amplitude (F/F0; B), integrated area under the curve (C), and FWHM (D) were measured as shown in the upper right corner. For each dataset, the mean is indicated by a filled black square with the colored boxes and whiskers delimiting the 25th and 75th percentile, and the 10th and 90th percentile of the pooled data, respectively, and small dots individual data points. N: number of animals; n: number of cells. SMC-GCaMP3 + 5-HT: N = 7, n = 114 for peak, area under the curve, and FWHM, and n = 116 for frequency; SMC-GCaMP3 + 5-HT + CaCCInh-A01 (CaCCInh): N = 7, n = 15 for peak, area under the curve, and FWHM, and n = 76 for frequency; SMC-GCaMP3 + 5-HT + nifedipine (Nif): N = 2, n = 32 for peak, area under the curve, and FWHM, and n = 47 for frequency; GCaMP3 + 5-HT + CPA: N = 2, n = 29; SMC-ANO1-KO-ΔEx12-GCaMP3; 5-HT: N = 7, n = 39 for peak, area under the curve, and FWHM, and n = 137 for frequency. For all panels, ***, **, and * indicate a significant difference between means with P < 0.001, P < 0.01, and P < 0.05, respectively.

