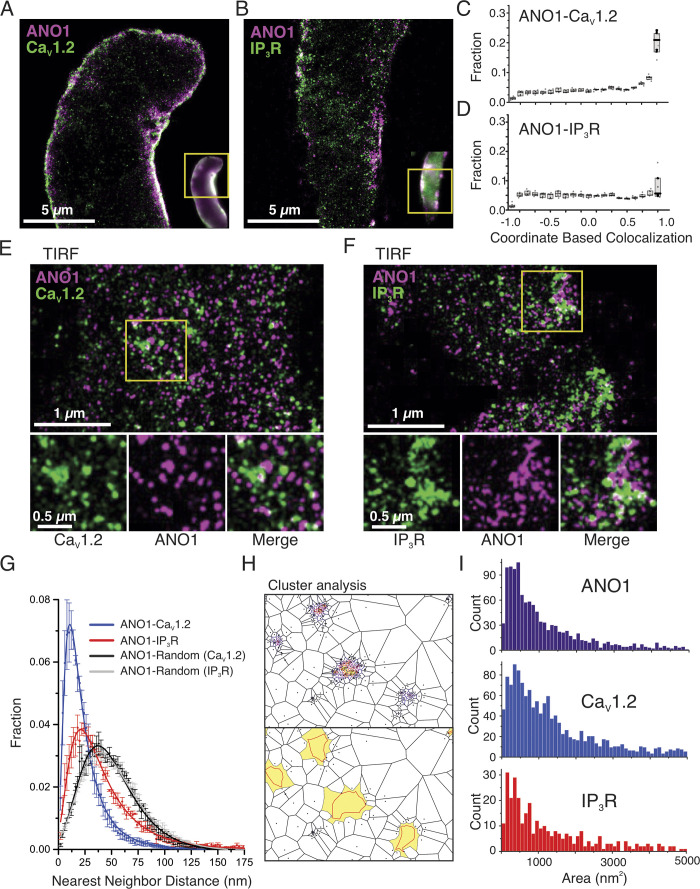
Figure 9.
Superresolution imaging of ANO1, CaV1.2, and IP3R at the PM of PASMCs from wild-type mice. (A and B) Superresolution images of PASMCs labeled for ANO1 and CaV1.2 (A) or ANO1 and IP3R (B) were imaged using GSDIM in epifluorescence mode. Epifluorescence images are shown in the inset for reference, with the yellow box demonstrating the region for GSD imaging. (C and D) Coordinate-based colocalization (CBC) of ANO1-CaV1.2 (C) or ANO1 and IP3R (D) where −1 shows mutual exclusion and +1 shows high correlation. (E and F) Superresolution images of PASMCs labeled with ANO1 and CaV1.2 (E) or ANO1 and IP3R (F) were imaged using GSDIM in TIRF mode. Enlargements of the white boxes are shown to the right, highlighting the adjacent location of the protein pairs. (G) Nearest neighbor analysis of the protein pairs demonstrates that the single-molecule localizations of CaV1.2 (blue) and IP3R (red) are both located closer to ANO1 than would be expected for a randomly distributed protein (black and grey). (H) An example of Voronoï-based segmentation of CaV1.2 single-molecule localizations (top) and the corresponding identified clusters are shown in yellow with the outline of the identified clusters denoted by the red line (bottom). (I) Cluster sizes of ANO1 (top), CaV1.2 (middle), and IP3R (bottom) as determined using SR-Tesseler analysis as shown in H.

