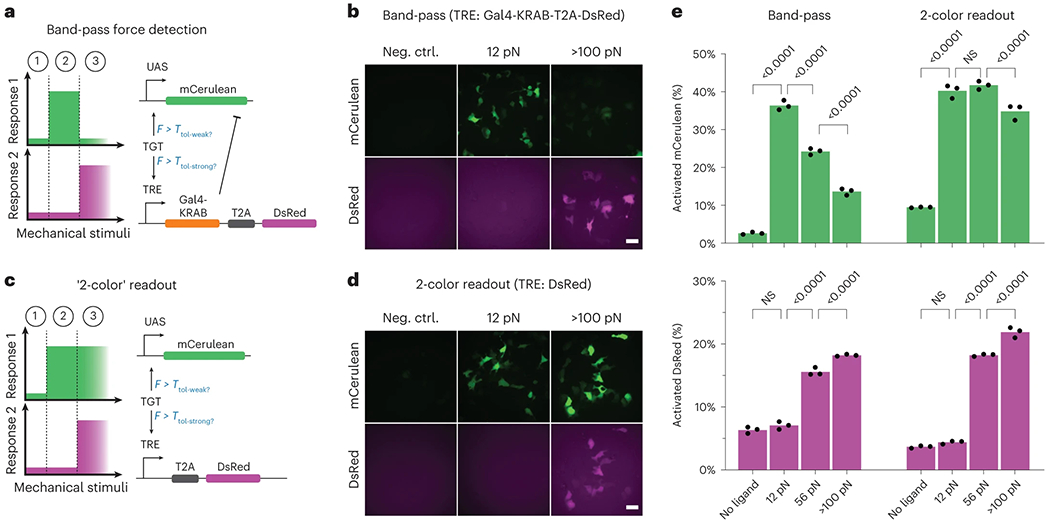
Fig. 3: Band-pass filtering in mechanogenetic circuits.

a, Schematic of the IFFL for detecting intermediate forces. An NRR-based SynNotch with a Gal4-VP64 ICD drives expression of a mCerulean encoding gene upon its activation. A sNRRY186F-based SynNotch with tTA ICD drives the expression of a bicistronic gene encoding DsRed-Express2 (DsRed-E2) in combination with Gal4-KRAB, the latter of which is able to inhibit transcription from UAS-mCerulean. b, Fluorescence images of reporter activity in HEK293-FT cells containing the band-pass circuit and grown on control (no ligand) surfaces, or on those containing either 12 pN TGTs (12 pN) or neutravidin-immobilized FITC (>100 pN). c, Schematic of ‘2-color’ readout system, in which high-tension ligands induce dual expression of mCerulean and DsRed-E2 fluorescent proteins. d, Fluorescence images of reporter activity in HEK293-FT cells expressing 2-color readout circuits. Cells were grown on surfaces like those in b. e, Quantified readouts of mCerulean (top graphs) and DsRed-E2 (bottom graphs) expression in cells expressing the indicated mechanogenetic circuits and grown on control surfaces (no ligand), or on those containing 12 pN TGTs (12 pN), 54 pN TGTs (54 pN) or neutravidin-immobilized FITC (>100 pN). Mean values from three independent cotransfections (n = 3) are displayed, as measured by flow cytometry (over 1,000 cells assessed per replicate) and analyzed with two-way ANOVA (mechanogenetic circuit and TGT threshold). P values of multiple comparisons within circuit type, across TGT thresholds are shown on the plot. Scale bars are 25 μm.
