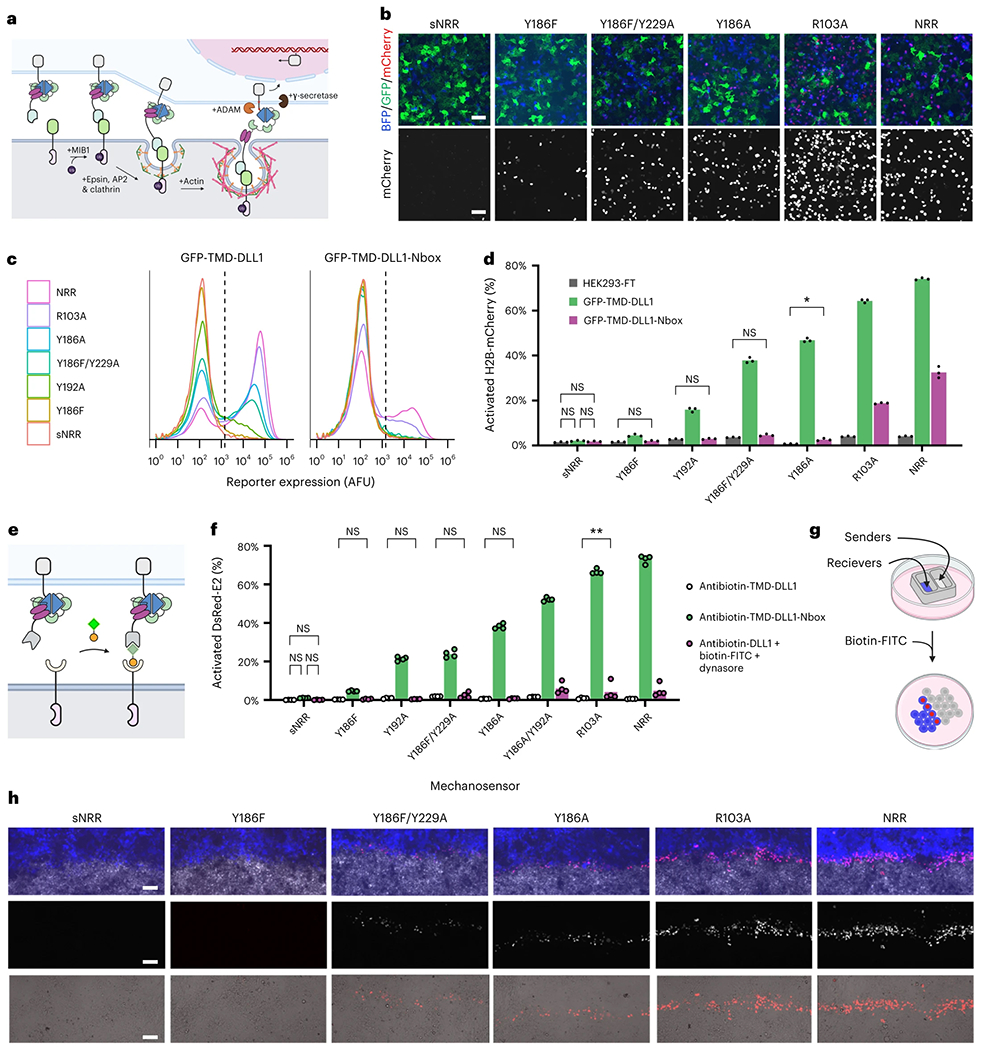
Fig. 4: Intercellular mechanotransduction via cell-generated, ubiquitination-dependent endocytic forces.

a, Schematic of ligand-mediated SynNotch trans-activation. Ubiquitination of the DLL1 intracellular tail by MIB1 induces its association with cargo-specific adapter proteins (epsins) for uptake by CME machinery. Endocytosis applies a pulling force against the ligand-bound SynNotch to expose its cryptic S2 proteolytic site for proteolysis. b, LaG16-sNRR variants are trans-activated by GFP-TMD-DLL1 senders to varying degrees. Receptors stably integrated in HEK293-FT reporter cells upregulate the expression of a UAS-driven H2B-mCherry reporter gene upon trans-activation by GFP-TMD-DLL1 ligand, also expressed in HEK293-FT (cells were cocultivated for 24 h). c, Flow cytometry traces of stably transduced receiver cell reporter expression levels following coculture with either GFP-TMD-DLL1 or GFP-TMD-DLL1-Nbox sender cells. Traces represent normalized densities of receiver (BFP+) cells within the analyzed coculture populations. Dashed vertical lines indicate H2B-mCherry+ threshold fluorescence values. d, Percent of H2B-mCherry+ reporter cells in receiver cell population (T2A-BFP+) from b shown as mean values alongside those from control cocultures containing mock ligand cells (HEK293-FT). Mean values from three independent experiments (n = 3) are displayed, as quantified by flow cytometry (over 5,000 cells assessed per replicate) and analyzed with two-way ANOVA (ligand version and mechanosensor). All unlabeled comparisons within the same mechanosensor have P < 0.0001; labeled NS, P > 0.05, *P < 0.05, **P < 0.01, otherwise. e, Schematic depicting drug-induced receptor trans-activation. Antibiotin-TMD-DLL1 ligand cells (bottom) undergo trans-cellular complex formation with anti-FITC receiver cells (top) upon exposure to the bispecific small molecule biotin-FITC (shown with FITC as a green square and biotin as an orange circle). f, U2OS receiver cell-signaling activities quantified from nonpatterned sender–receiver mixtures with HEK293-FT antibiotin-TMD-DLL1 senders without exposure to the bridging molecule (gray bars), or after overnight treatment with biotin-FITC (2 nM; green bars) or with dual treatment using biotin-FITC (2 nM) and the dynamin inhibitor dynasore (80 μM; magenta bars). Green and magenta bars represent U2OS receiver cell mixtures with HEK293-FT antibiotin-TMD-DLL1 senders. Gray bars represent nontreated cocultures without biotin-FITC. Quantifications represent fluorescence reporter gene expression levels (U2OS:UAS-DsRed-Express2), shown as DsRed+ cell percentages within receptor-expressing (T2A-BFP+) populations. Mean from four independent experiments (n = 4) displayed, quantified by flow cytometry (over 1,000 cells assessed per replicate) and analyzed with two-way ANOVA (drug treatment and NRR type). All unlabeled comparisons within the same mechanosensor have P < 0.0001; labeled NS, P > 0.05, *P < 0.05, **P < 0.01, otherwise. g, Schematic showing microwell patterning strategy for generating spatially defined sender–receiver interfaces. h, Fluorescence imaging H2B-mCherry reporter expression levels at the interface between sender and receiver populations. HEK293-FT antibiotin-TMD-DLL1 senders were used in combination with HEK293-FT receivers containing a UAS-H2B-mCherry reporter gene. Cells were treated with 2 nM biotin-FITC for 24 h before imaging. Top images: blue represents receiver cells (receptor-T2A-BFP), white marks sender cells (SNAP-Surface-AlexaFluor647) and red represents H2B-mCherry reporter. Middle and bottom images show H2B-mCherry levels in grayscale (middle), or in red as overlaid with transmitted light (bottom). Scale bars in b and d are 100 μm.
