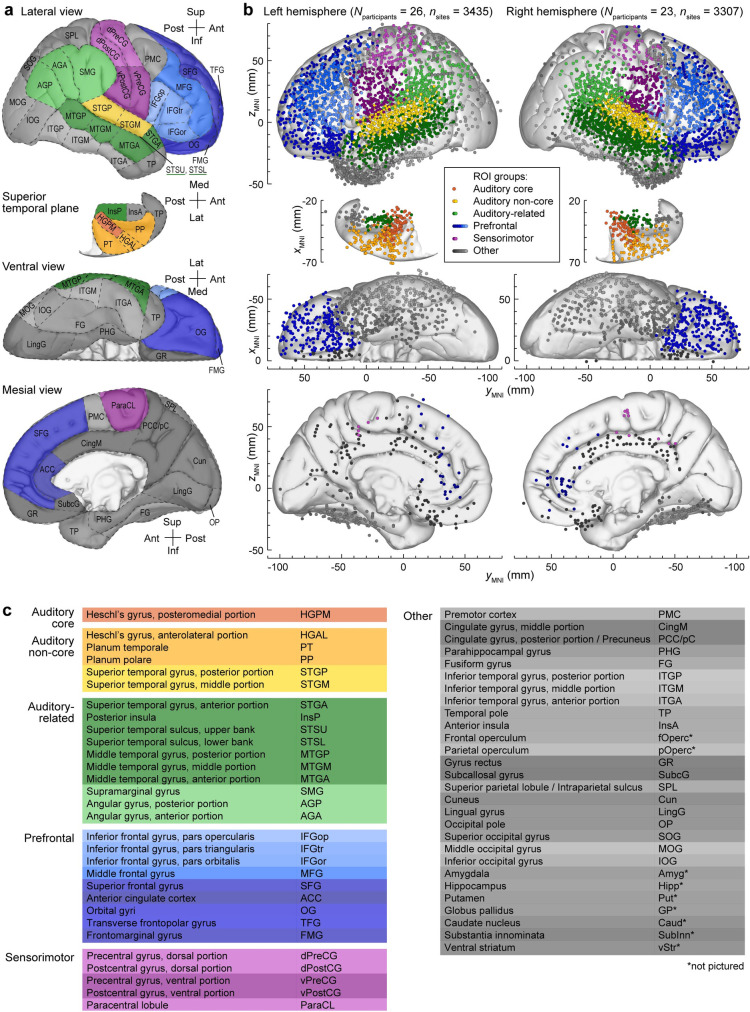
Fig 1. ROIs and electrode coverage in all 49 participants.
(a) ROI parcellation scheme. (b) Locations of recording sites, determined for each participant individually and color-coded according to the ROI group, are plotted in Montreal Neurological Institute (MNI) coordinate space and projected onto the Freesurfer average template brain for spatial reference. All depicted sites were within cortical gray matter; some appear as outside the brain due to individual variability in brain anatomy relative to the template brain. Color shades represent different ROIs within a group. Projections are shown on the lateral, top-down (superior temporal plane), ventral and mesial views (top to bottom). Recording sites over orbital, transverse frontopolar, inferior temporal gyrus, and temporal pole are shown in both the lateral and the ventral view. Sites in fusiform, lingual, parahippocampal gyrus and gyrus rectus are shown in both the ventral and medial view. See S2 Table for detailed information on electrode coverage. Sites in the frontal operculum (n = 23), parietal operculum (n = 21), amygdala (n = 80), hippocampus (n = 86), putamen (n = 15), globus pallidus (n = 1), caudate nucleus (n = 10), substantia innominata (n = 5), and ventral striatum (n = 2) are not visible due to the opacity of the template brain but are included in S2 Table. (c) ROI groups, ROIs, and abbreviations used in the present study. See S3 Table for alphabetized list of abbreviations.

