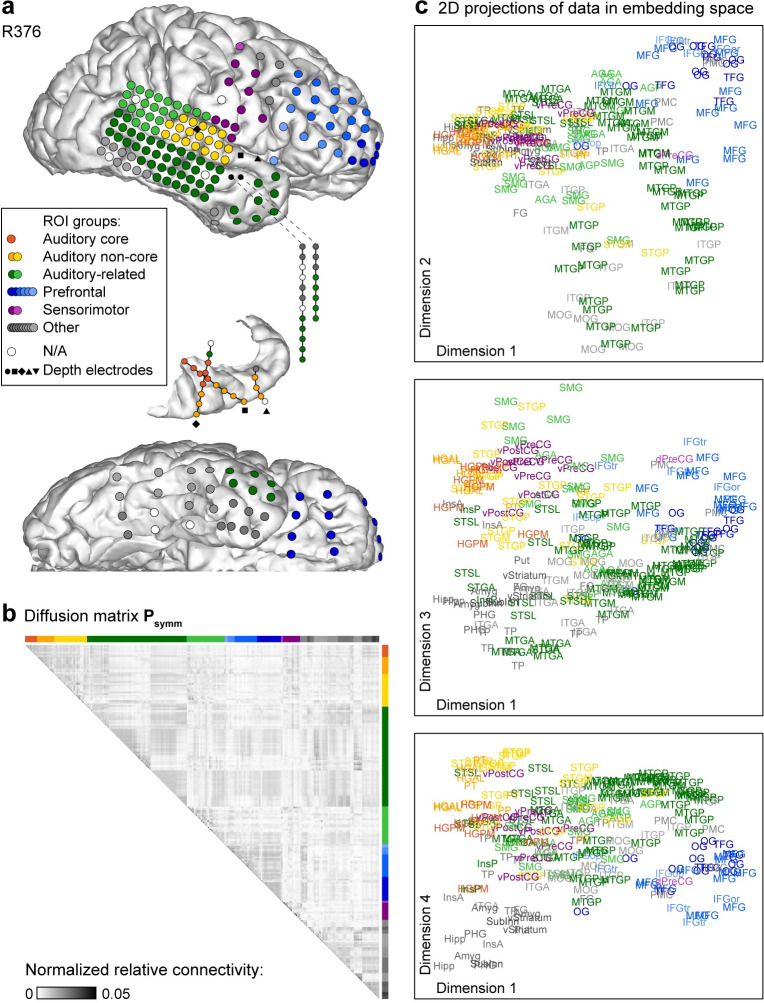
Fig 2. Functional geometry of cortical networks revealed by DME applied to gamma band power envelope correlations in a single participant (R376).
(a) Electrode coverage. (b) Diffusion matrix Psymm. (c) Data plotted on the same scale in the first and second, first and third, and first and fourth dimensions of embedding space (top to bottom). Two points that are close in embedding space are similarly connected to the rest of the network and thus assumed to be functionally similar.

