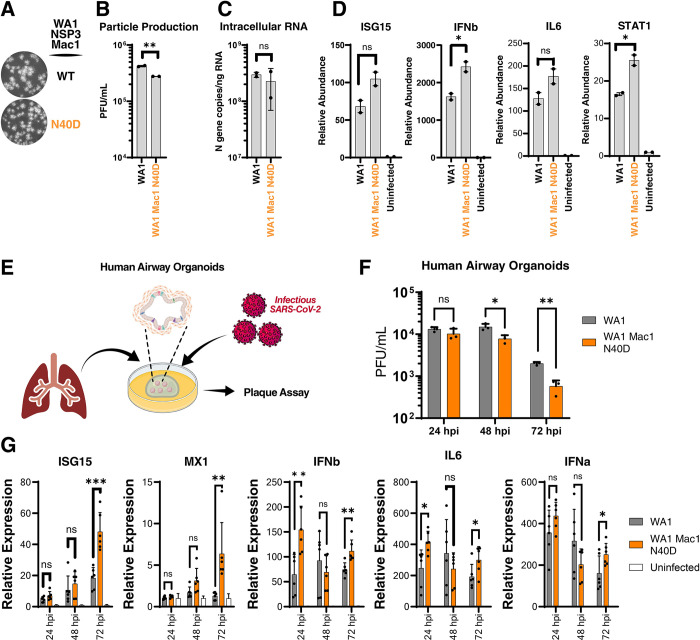
Fig 3. SARS-CoV-2 Mac1 domain N40D mutant is attenuated in human airway organoids.
A) Plaque morphology of indicated viruses in VAT cells. The images were pseudocolored in grayscale to optimize plaque visualization. B) Viral particle release of infected Calu3 cells (MOI 0.01) with indicated viruses was measured at 48 hours post-infection by plaque assay on VAT cells. Data are presented as mean +/- SD of two biological replicates conducted in duplicate. C) Intracellular viral RNA (N gene copies) of Calu3 cells in B was measured by RT-qPCR using a standard curve. Data are presented as mean +/- SD of two biological replicates conducted in duplicate. D) Relative levels of ISG15, IFNb, IL6, and STAT1 in Calu3 cells in B normalized to uninfected cells were determined by RT-qPCR. Data are presented as mean +/- SD of two biological replicates conducted in duplicate. E) Experimental workflow of the generation of primary human lung organoids and infection with SARS-CoV-2. Clip art was created with BioRender.com with permission. F) Viral particle release of infected primary human lung organoids with indicated viruses was measured at indicated times post-infection by plaque assay on VAT cells. Data are presented as mean +/- SD of one biological replicate conducted in triplicate. G) Relative levels of ISG15, MX1, IFNb, IL6, and IFNa to 18s RNA in infected human airway organoids in F normalized to uninfected organoids were determined by RT-qPCR. Data are presented as mean +/- SD of one biological replicate conducted in triplicate. *, p<0.05; **, p<0.01; ***, p<0.001 by two-sided Student’s T-test.

