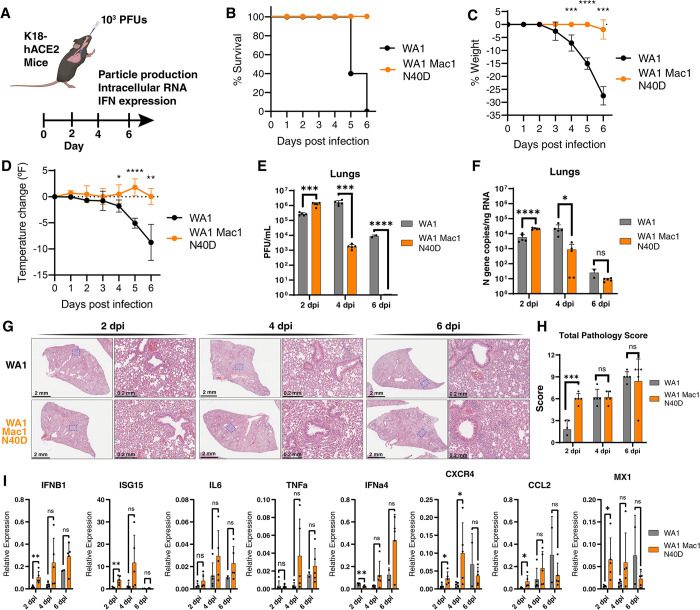
Fig 4. SARS-CoV-2 Mac1 N40D mutant is attenuated in K18-hACE2 mice.
A) K18-hACE2 mice (5 mice per group per timepoint) were infected with 103 PFUs of WA1 and WA1 Mac1 N40D viruses intranasally. At 2, 4, and 6 days post-infection, the lung tissue was collected for viral particle abundance measurement by plaque assay (VAT) and viral RNA and innate immune response gene expression analysis by RT-qPCR. Clip art was created with BioRender.com with permission. B) Survival curve of mice infected in A. C) Change in body weight of mice infected in A. Data are shown as mean ± SD. D) Change in body temperature of mice infected in A. Data are shown as mean ± SD. E) Viral particle abundance in the lungs was measured by plaque assay (VAT). Data are presented as mean +/- SD. F) Viral RNA levels in the lungs were measured by RT-qPCR using a standard curve. Data are presented as mean +/- SD. G) Hematoxylin and eosin (H&E) staining of lungs of mice infected in A. H) Total pathology scores of all infected mice lungs in G. Breakdown of scores is available in S7 Fig. I) Relative levels of IFNB1, ISG15, IL6, TNFa, IFNa4, CXCR4, CCL2, and MX1 to GAPDH were determined by RT-qPCR. Data are presented as mean +/- SD. *, p<0.05; **, p<0.01; ***, p<0.001; ****, p<0.0001 by two-sided Student’s T-test.

