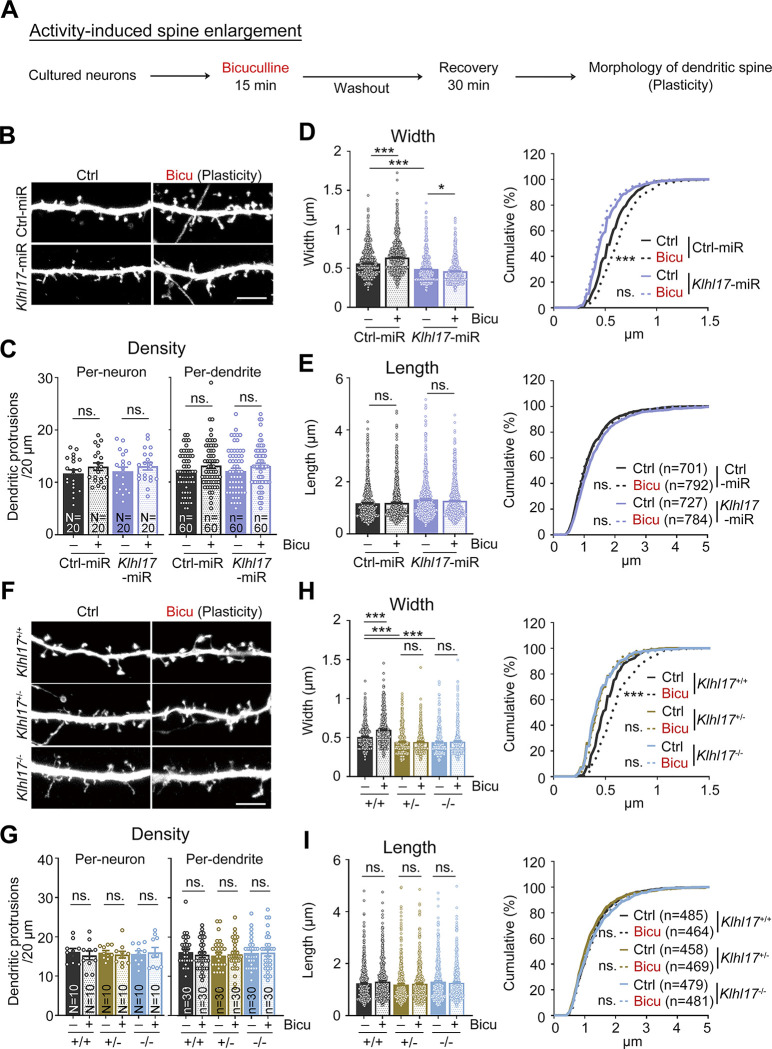
Fig 2. KLHL17 is required for activity-dependent dendritic spine enlargement.
(A) Flowchart of activity-induced spine enlargement. Cultured neurons were transfected with the indicated plasmids at 12 DIV and harvested for immunostaining at 18 DIV. Bicuculline (40 μM) was added into the culture for 15 min and then cultures were subjected to washout for a further 30 min recovery to induce activity-dependent spine enlargement. The morphology of dendritic protrusions was outlined by GFP signals. (B–E) Klhl17 knockdown impairs the synaptic enlargement induced by bicuculline treatment. (F–I) Both Klhl17+/–and Klhl17–/–neurons fail to respond to bicuculline treatment. (B, F) Representative images of dendritic segments. (C, G) Quantification of protrusion density. Both per-neuron- and per-dendrite-based analyses were performed. (D, H) Quantification of the width of dendritic protrusions. (E, I) Quantification of the length of dendritic protrusions. Samples were randomly assigned to treatments. The sample size “N” indicates the number of examined neurons and “n” represents the number of examined dendritic segments in (C) and (G). In (E) and (I), the sample size “n” indicates the number of dendritic spines examined. For the same sets of experiments, sample sizes are only shown in 1 panel. The data represent mean ± SEM and cumulative curve (D and E: right, H and I: right). Individual data points are also shown. * P < 0.05; *** P < 0.001; ns, not significant. Two-way ANOVA (C–E: left, G–I: left); Kolmogorov–Smirnov test for cumulative probability (D and E: right; H and I: right). Scale bars: (B, F) 5 μm. The numerical value data and statistical results are available in S1 and S2 Data, respectively. DIV, day in vitro; KLHL17, Kelch-like protein 17.

