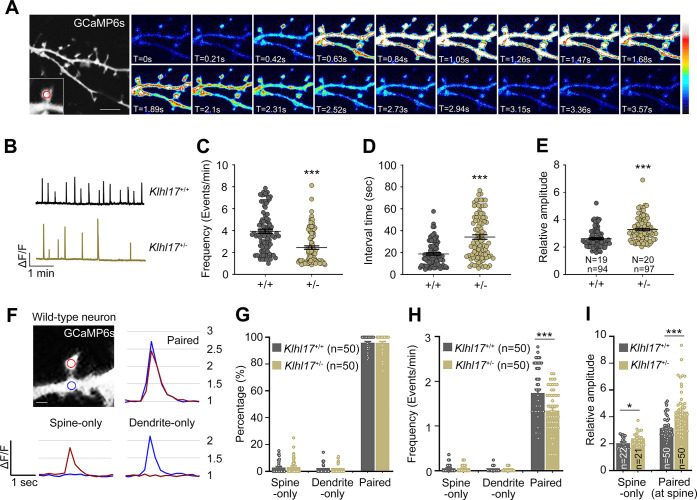
Fig 4. Klhl17 deficiency alters the frequency and amplitude of calcium events.
Klhl17+/–neurons exhibit a reduced frequency and higher amplitude of spontaneous calcium events. Cultured neurons were transfected with GCaMP6s plasmids at 12 DIV and then calcium recording was performed by live-imaging at 18–19 DIV. (A) Representative images of recorded frames. Image series showing the change in calcium concentration based on GCaMP6s fluorescence signal intensity. The enlarged segment represents an example of an analyzed dendritic spine and the red circle indicates the ROI. The heat maps show the relative intensities of calcium signals. (B–E) Analysis of total calcium events at dendritic spines. (B) Representative patterns of calcium events. Scale units: amplitude (ΔF/F) and time (1 min). The calcium dynamics were analyzed based on the parameters of frequency (C), interval time (D), and calcium amplitude (E). Samples were randomly collected from multiple independent experiments. The sample size shown in (E) represents the number of examined neurons (N) and the number of examined dendritic spines (n) for the results shown in (C–E). (F–I) Paired analysis of calcium events at the spines and dendrites. (F) A representative dendritic segment with 2 ROIs; one in the spine (red) and the other in the dendrite (blue). Calcium events were categorized into 3 types: spine-only, dendrite-only, and both spine and dendrite with spikes at the same time (paired). Examples of these 3 types of events from wild-type neurons are shown. The relative amplitude (1, 1.5, 2, 2.5, 3) is also indicated at right. The percentage (G), frequency (H), and amplitude (I) of these 3 types of events are shown. The number (n) of examined paired ROIs was 50. In (I), the amplitude of all detected spine-only events was analyzed. The sample size is indicated. For paired events, the average amplitude of the paired ROIs at spines is shown. The data represent mean ± SEM. Individual data points are also shown. * P < 0.05, *** P < 0.001; unpaired two-tailed t test. Scale bars: (A) 5 μm, (F) 1 μm. The numerical value data and statistical results are available in S1 and S2 Data, respectively. DIV, day in vitro; KLHL17, Kelch-like protein 17; ROI, region of interest.

