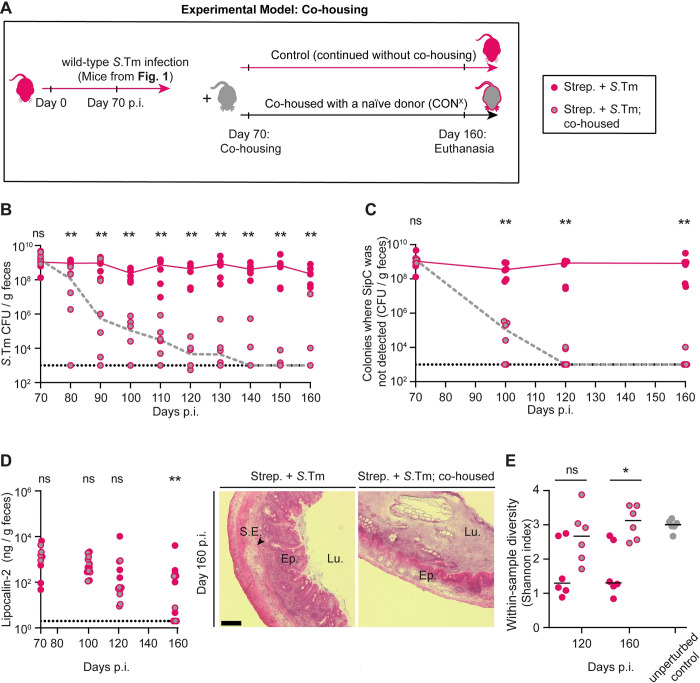
Fig 3. Microbiota transfer from uninfected CONX mice displaces mutant-dominated Salmonella populations from wild-type S.
Typhimurium infected mice. (A) Experimental scheme. After day 70 of infection with wild-type S. Typhimurium (from Fig 1A–1E; n = 12) the mice were either co-housed with an untreated CONX mouse (pink, gray filled circles; n = 6 mice; each infected mouse was caged with a healthy mouse) or kept under hygienic isolation (pink filled circles; n = 6 mice). (B) Salmonella population sizes as determined using MacConkey plates with selective antibiotics. (C) Size of Salmonella population that did not yield SipC signals in the colony protein blot assay, as determined by multiplying the percentage of the colonies without detectable SipC signal with the pathogen population (as shown in B). (D) Gut inflammation. Left: Lipocalin-2 concentration in the feces, as determined by ELISA (fecal pellets from at least n = 6 mice analyzed per time point). Dotted lines indicate the detection limit. Lines connect the median values at the days of analysis. Right: representative images of HE-stained cecum tissue sections; scale bar 100 μm. (E) Microbial community analysis of fecal samples at day 120 and day 160 p.i. The within-sample diversity was measured using the Shannon Index (pink circles: no co-housing, pink, gray filled circles: co-housed; gray circles; feces from donor mice (that is unperturbed CONX animals)). The data shown was obtained from 2 independent experiments including comparing both groups. Two-tailed Mann–Whitney U tests were used to compare the data from mice with or without co-housing at each time point (p ≥ 0.05 not significant (ns), p < 0.05 (*), p < 0.01 (**), p < 0.001 (***), p < 0.0001 (****)). Source data can be found in S1 Data file.

