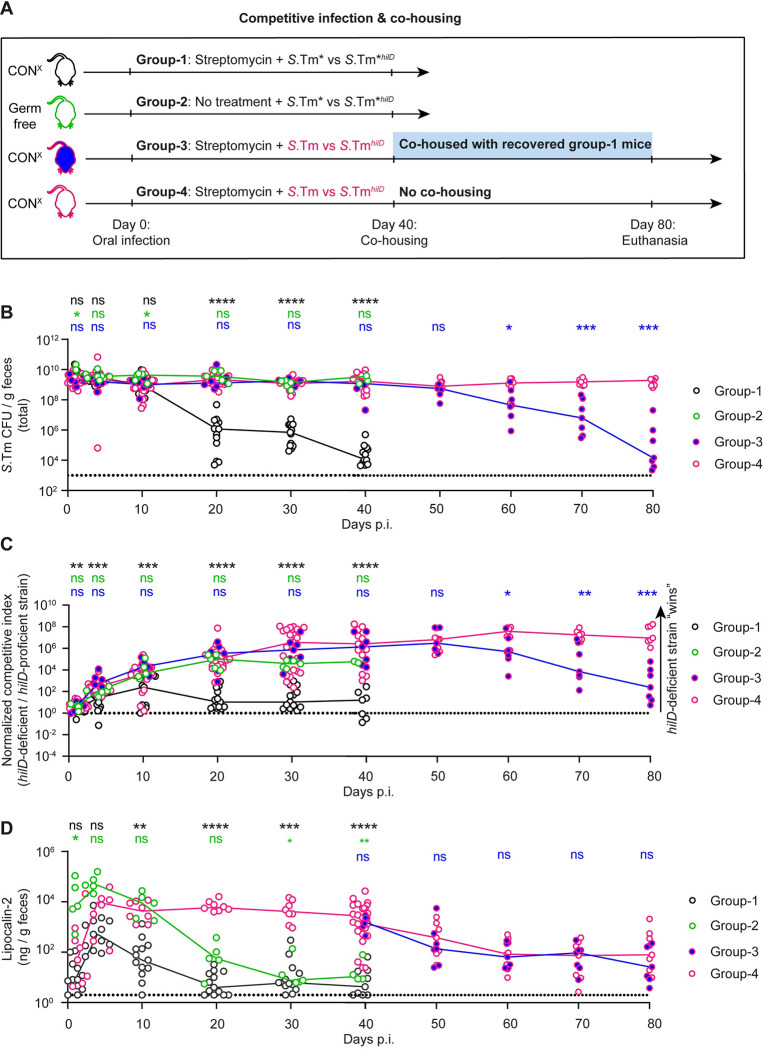
Fig 4. Microbiota transfer from S.Tm*-infected mice can displace the mutant-dominated pathogen population selected for during wild-type S.
Typhimurium infection. (A) Experimental scheme. We employed 4 groups of mice: 1. Streptomycin pretreated CONX mice were infected for 40 days with a 1:10 (n = 6 mice) or a 100:1 (n = 7 mice) S.Tm* vs. S.Tm*hilD (black symbols with white filling; n = 13 mice; 5 × 10⁷ CFU, by gavage). By day 40 p.i., this group yielded the donor mice (black). 2. Germ-free C57BL/6 mice were infected for 40 days with a 100:1 mix of S.Tm* vs. S.Tm*hilD (green symbols with white filling; n = 5 mice; 5 × 10⁷ CFU, by gavage). 3. and 4. Streptomycin pretreated CONX mice were infected for 40 days with a 1:10 (n = 8 mice) or a 100:1 (n = 20 mice) mix of S.Tm* vs. S.Tm*hilD (pink symbols with blue filling, or pink symbols with white filling respectively; 5 × 10⁷ CFU, by gavage). By day 40 p.i., this yielded the 2 experimental groups. 3. At day 40, we co-housed mice from group 3 (n = 7 mice) with mice from group 1 and followed the infection until day 80. 4. The mice remained under hygienic isolation (n = 7 mice) until day 80 p.i. (B) Total Salmonella loads in the feces, as determined using MacConkey plates with selective antibiotics. (C) Competitive index of the hilD-deficient vs. the hilD-proficient strains in the respective groups, as calculated from selective plating data. (D) Lipocalin-2 concentration in the feces, as determined by ELISA (fecal pellets from 5 to 14 mice per group, as indicated per group and per time point). Colored lines connect the medians. For each group, we show the pooled data from at least 2 independent experiments. Group 2 shows data from 1 experiment with 2 cohorts. Two-tailed Mann–Whitney U tests were used to compare the indicated groups: black symbols: group 1 vs. groups 4 (between days 0–40 p.i.); green symbols: group 2 vs. group 4 (between days 0–40 p.i.); blue symbols: group 3 vs. group 4 (between days 0–80 p.i.). (p ≥ 0.05 not significant (ns), p < 0.05 (*), p < 0.01 (**), p < 0.001 (***), p < 0.0001 (****)). Source data can be found in S1 Data file.

