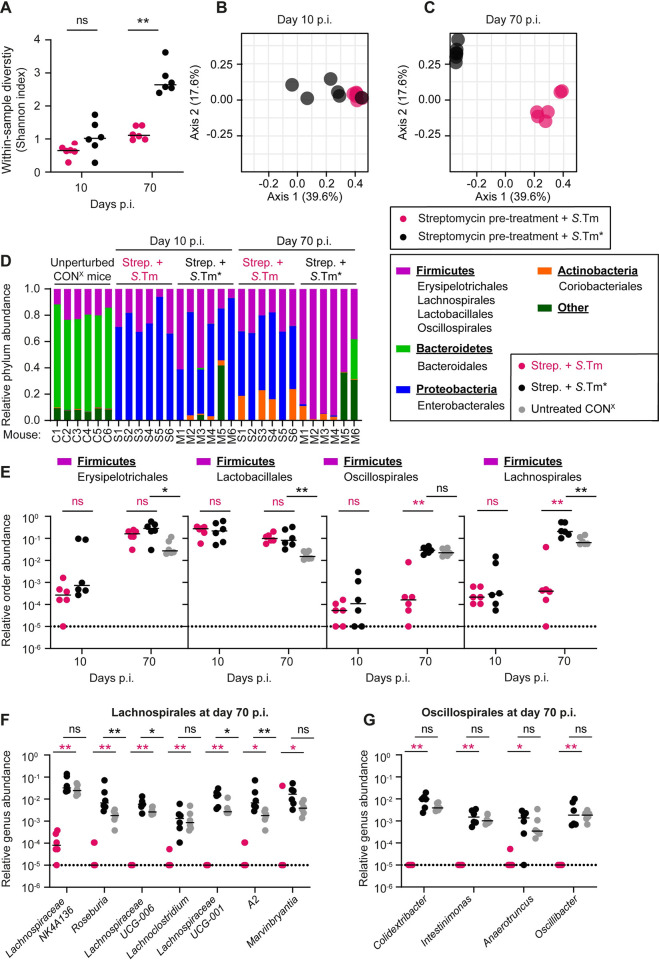
Fig 6. Long-lasting effect of wild-type S.
Typhimurium on the gut microbiota composition of streptomycin pretreated CONX mice. 16S sequencing was performed to analyze the microbial community in fecal samples from unperturbed CONX mice sampled at day 10 and day 70 p.i. in the experiment shown in Fig 1B–1D. (A) Within-sample diversity measured using Shannon Index (pink circles: wild-type S. Typhimurium infection; black circles: S.Tm* infection). (B, C) Principal coordinate analysis based on Bray–Curtis dissimilarities between samples (after the square-root transformation of abundances). Data points represent individual mice, and a colored border defines the grouping of data points within each sample group. (PERMANOVA R2 = 0.397 and p = 0.0045 for day 10 p.i. and R2 = 0.661 and p = 0.0024 for day 70 p.i. (D) Relative abundances ASVs at the phylum level. The 4 most abundant phyla are shown, with the rest of the community shown as “other”. (E) Relative abundances of most abundant orders belonging to the phylum of Firmicutes. Orders were compared at day 10 and 70 p.i. Fecal microbiota from unperturbed CONX mice (gray circles), which served as donors in Fig 3, were used as controls. (F, G) Relative abundances of most abundant genera belonging to the orders of Lachnospirales and Oscillospirales, respectively. Genera were compared at day 10 and 70 p.i. between wild-type S. Typhimurium and S.Tm*-infected mice; fecal microbiota from unperturbed CONX mice (gray circles) were used as controls. (E–G) Dotted line indicates the detection limit. Lines indicate the median. Two-tailed Mann–Whitney U tests were used to compare wild-type S. Typhimurium to S.Tm*-infected samples (Panel A black stars, Panel E–G pink stars) or S.Tm* infected to untreated CONX mice (Panel E–G; black stars) (p ≥ 0.05 not significant (ns), p < 0.05 (*), p < 0.01 (**), p < 0.001 (***), p < 0.0001 (****)). Source data can be found in S1 Data file.

